

We have audited the financial statements of Prime Lands Residencies PLC (the “Company”), which comprise the statement of financial position as at 31st March 2021, and the statement of comprehensive income, statement of changes in equity and statement of cash flows for the year then ended, and notes to the financial statements, including a summary of significant accounting policies as set out on pages 95 to 132.
In our opinion, the accompanying financial statements give a true and fair view of the financial position of the Company as at 31st March 2021, and of its financial performance and its cash flows for the year then ended in accordance with Sri Lanka Accounting Standards.
As disclosed in Note: 15 to the Financial Statements, the Company’s Inventory Properties including work in progress and completed apartments for sale amounted to Rs. 11,086,722,148/- as at 31st March 2021. Inventory Properties account for 85% of the Company’s total assets and are measured at the lower of cost and Net Realisable Value (NRV).
The disclosures associated with measurement of Inventory Properties are set out in the financial statements in the following notes:
In establishing whether the Inventory Properties – work in progress and completed apartments for sale were stated at the lower of cost and NRV, our procedures included the following:
Management is responsible for the other information. The other information comprises the information included in the Annual Report. The Annual Report is expected to be made available to us after the date of this auditor’s report.
Our opinion on the financial statements does not cover the other information and we do not express any form of assurance conclusion thereon.
In connection with our audit of the financial statements, our responsibility is to read the other information identified above when it becomes available and, in doing so, consider whether the other information is materially inconsistent with the financial statements or our knowledge obtained in the audit, or otherwise whether it appears to be materially misstated.
When we read the Annual Report, if we conclude that there is a material misstatement therein, we are required to communicate the matter to those charged with governance.
Management is responsible for the preparation of financial statements that give a true and fair view in accordance with Sri Lanka Accounting Standards, and for such internal control as management determines, is necessary to enable the preparation of financial statements that are free from material misstatement, whether due to fraud or error.
In preparing the financial statements, management is responsible for assessing the Company’s ability to continue as a going concern, disclosing, as applicable, matters related to going concern and using the going concern basis of accounting unless management either intends to liquidate the Company or to cease operations, or has no realistic alternative but to do so.
Those charged with governance are responsible for overseeing the Company’s financial reporting process.
Our objectives are to obtain reasonable assurance about whether the financial statements as a whole are free from material misstatement, whether due to fraud or error, and to issue an auditor’s report that includes our opinion. Reasonable assurance is a high level of assurance, but is not a guarantee that an audit conducted in accordance with SLAuSs will always detect a material misstatement when it exists. Misstatements can arise from fraud or error and are considered material if, individually or in the aggregate, they could reasonably be expected to influence the economic decisions of users taken on the basis of these financial statements.
As part of an audit in accordance with SLAuSs, we exercise professional judgment and maintain professional skepticism throughout the audit. We also:
We communicate with those charged with governance regarding, among other matters, the planned scope and timing of the audit and significant audit findings, including any significant deficiencies in internal control that we identify during our audit.
We also provide those charged with governance with a statement that we have complied with ethical requirements in accordance with the Code of Ethics regarding independence, and to communicate with them all relationships and other matters that may reasonably be thought to bear on our independence, and where applicable, related safeguards.
From the matters communicated with those charged with governance, we determine those matters that were of most significance in the audit of the financial statements of the current period and are therefore the key audit matters. We describe these matters in our auditor’s report unless law or regulation precludes public disclosure about the matter or when, in extremely rare circumstances, we determine that a matter should not be communicated in our report because the adverse consequences of doing so would reasonably be expected to outweigh the public interest benefits of such communication.
As required by section 163 (2) of the Companies Act No. 07 of 2007, we have obtained all the information and explanations that were required for the audit and, as far as appears from our examination, proper accounting records have been kept by the Company.
CA Sri Lanka membership number of the engagement partner responsible for signing this independent auditor’s report is 3890.
Sujeewa Rajapakse FCA, FCMA, MBA. Ashane J.W. Jayasekara FCA, FCMA (UK), MBA. H. Sasanka Rathnaweera FCA, ACMA. R. Vasanthakumar Bsc (Acc), ACA. F. Sarah Z.Afker ACA, ACMA(UK), CGMA, MCSI (UK). M.N. Mohamed Nabeel ACA. D. Jerad N. Dias ACA. Madhura V. De Silva FCA, MSc.
Note | For the year ended 31.03.2021 Rs. | For the year ended 31.03.2021 Restated Rs. |
|
|---|---|---|---|
| Revenue | 4 | 7,732,398,134 | 5,716,288,413 |
| Cost of sales | (5,838,879,143) | (4,643,344,148) | |
| 1,893,518,991 | 1,072,944,265 | ||
| Other income | 5 | 26,091,431 | 15,222,371 |
| Gain on fair valuation of investment property | 12 | 6,835,863 | 4,578,424 |
| Distribution expenses | (31,165,383) | (29,779,794) | |
| Administrative expenses | (310,241,352) | (268,716,390) | |
| 1,585,039,550 | 794,248,876 | ||
| Finance income | 6.1 | 104,741,231 | 27,302,208 |
| Finance expenses | 6.2 | (412,363,514) | (639,767,576) |
| 7 | 1,277,417,267 | 181,783,508 | |
| Tax expenses | 8 | (288,161,691) | (50,987,616) |
| 989,255,576 | 130,795,892 | ||
| Actuarial gain on retirement benefit obligation | 1,288,798 | 982,633 | |
| Tax on other comprehensive income | (309,312) | (196,527) | |
| 979,486 | 786,106 | ||
| 990,235,062 | 131,581,998 | ||
| Earnings per share | 9 | 1.32 | 0.17 |
Figures in brackets indicate deductions.
The accounting policies and notes on pages 95 to 132 form an integral part of these financial statements.
Colombo
22nd July 2021
Note | As at 31.03.2021 Rs. | As at 31.03.2020 Restated Rs. | As at 01.04.2019 Restated Rs. |
|
|---|---|---|---|---|
| Property, plant and equipment | 10 | 9,815,316 | 14,639,070 | 12,300,542 |
| Right-of-use assets | 11 | 79,151,955 | 97,290,811 | 63,788,271 |
| Investment properties | 12 | 660,000,000 | 653,000,000 | 689,000,000 |
| Intangible assets | 13 | 474,231 | 166,027 | 161,665 |
| Financial assets at amortized cost | 14 | 352,939,048 | 270,194,898 | 269,724,650 |
| 1,102,380,550 | 1,035,290,806 | 1,034,975,128 | ||
| Inventory properties - Apartments | 15 | 11,086,722,148 | 8,505,835,575 | 10,268,673,606 |
| Financial assets - Fair value through profit or loss | 16 | 195,000 | 180,000 | 208,500 |
| Advance paid for contractors | 17 | 357,326,947 | 3,807,469,438 | 2,274,705,470 |
| Advances, deposits and other receivables | 18 | 76,492,373 | 61,442,854 | 94,275,000 |
| Income tax recoverable | 19 | 4,478,359 | ||
| Cash and cash equivalents | 20 | 376,799,448 | 172,541,712 | 213,128,971 |
| 11,897,535,916 | 12,547,469,579 | 12,855,469,906 | ||
| 12,999,916,466 | 13,582,760,385 | 13,890,445,034 | ||
| Stated capital | 21 | 1,500,000,000 | 1,500,000,000 | 1,500,000,000 |
| Retained earnings | 1,932,952,648 | 942,717,586 | 1,217,456,619 | |
| 3,432,952,648 | 2,442,717,586 | 2,717,456,619 | ||
| Retirement benefit obligations | 22 | 15,463,841 | 13,186,382 | 11,677,172 |
| Interest bearing borrowings | 23 | 2,333,941,373 | 1,589,086,191 | 2,551,769,163 |
| Lease liabilities | 24 | 42,750,007 | 48,270,500 | 26,870,169 |
| Deferred tax liabilities | 25 | 20,745,384 | 21,435,950 | 14,543,272 |
| 2,412,900,605 | 1,671,979,023 | 2,604,859,776 | ||
| Trade and other payables | 26 | 1,128,951,405 | 497,324,507 | 504,895,748 |
| Amount due to related party | 27 | 4,995,981 | 5,966,006 | 4,681,229 |
| Amount due to directors | 28 | - | 391,000,000 | - |
| Interest bearing borrowings - Current portion | 23 | 1,859,837,994 | 1,593,957,546 | 869,115,286 |
| Lease liabilities - Current portion | 24 | 11,442,245 | 9,383,560 | 4,031,557 |
| Customer advance collection | 29 | 2,537,768,562 | 3,915,371,098 | 4,859,171,238 |
| Income tax payable | 19 | 461,009,242 | 118,745,977 | - |
| Bank overdraft | 20 | 1,150,057,784 | 2,936,315,082 | 2,326,233,581 |
| 7,154,063,213 | 9,468,063,776 | 8,568,128,639 | ||
| 9,566,963,818 | 11,140,042,799 | 11,172,988,415 | ||
| 12,999,916,466 | 13,582,760,385 | 13,890,445,034 |
Figures in brackets indicate deductions.
The accounting policies and notes on pages 95 to 132 form an integral part of these financial statements.
Colombo
22nd July 2021
Certification.
We certify that the above Financial Statements have been prepared in compliance with the requirements of the Companies Act No. 07 of 2007.


Note | Stated capital Rs. | Retained earnings Rs. | Total Rs. |
|
|---|---|---|---|---|
| 1,500,000,000 | 1,227,055,639 | 2,727,055,639 | ||
| Impact on adoption of SLFRS/LKAS | 3.23.1 | - | 4,944,252 | 4,944,252 |
| Prior year adjustment | 37.2 | - | (14,543,272) | (14,543,272) |
| 1,500,000,000 | 1,217,456,619 | 2,717,456,619 | ||
| Impact on adoption of IFRIC 23 | - | (406,321,031) | (406,321,031) | |
| 1,500,000,000 | 811,135,588 | 2,311,135,588 | ||
| Profit for the year | - | 130,795,892 | 130,795,892 | |
| Other comprehensive income for the year, net of tax | - | 786,106 | 786,106 | |
| Total comprehensive income for the year | - | 131,581,998 | 131,581,998 | |
| 1,500,000,000 | 942,717,586 | 2,442,717,586 | ||
| Profit for the year | - | 989,255,576 | 989,255,576 | |
| Other comprehensive income for the year, net of tax | - | 979,486 | 979,486 | |
| Total comprehensive income for the year | - | 990,235,062 | 990,235,062 | |
| 1,500,000,000 | 1,932,952,648 | 3,432,952,648 |
Figures in brackets indicate deductions.
The accounting policies and notes on pages 95 to 132 form an integral part of these financial statements.
Colombo
22nd July 2021
| For the year ended 31.03.2021 Rs. | For the year ended 31.03.2020 Rs. |
|
|---|---|---|
| Profit before taxation | 1,277,417,267 | 181,783,508 |
| Depreciation | 37,424,321 | 29,456,977 |
| Amortization | 34,015 | 20,638 |
| Provision on retirement benefit obligation | 4,101,457 | 4,054,918 |
| Interest expenses | 103,975,413 | 214,664,259 |
| Lease interest | 10,644,856 | 8,785,384 |
| Loan interest | 295,981,235 | 401,305,871 |
| Interest on debentures | (18,236,546) | (14,698,485) |
| Fair value (gain)/ loss on share investment | (15,000) | 28,500 |
| Exchange (gain)/loss on investment in debenture | (64,507,604) | 14,228,237 |
| Fair value gain on investment property | (6,835,863) | (4,578,424) |
| 362,566,284 | 653,267,875 | |
| Operating cash flows before change in working capital | 1,639,983,551 | 835,051,383 |
| (Increase)/decrease in inventory properties | (2,580,886,573) | 1,762,838,031 |
| Decrease/(increase)in contractor advances | 3,450,142,491 | (1,532,763,968) |
| (Increase)/decrease in advances, deposits and other receivables | (15,049,519) | 32,832,146 |
| Increase/(decrease) in trade and other payables | 631,626,898 | (7,571,241) |
| (Decrease)/increase in amounts due to related parties | (970,025) | 1,284,777 |
| (Decrease)/increase in amounts due to directors | (391,000,000) | 391,000,000 |
| (Decrease)/increase in customer advance collection | (1,377,602,536) | (943,800,140) |
| 1,356,244,287 | 538,870,988 | |
| Income tax paid | (110,862,296) | (327,388,160) |
| Income tax refund | 163,963,992 | - |
| Interest paid | (103,975,413) | (214,664,259) |
| Gratuity paid | (535,200) | (1,563,075) |
| 1,304,835,370 | (4,744,506) | |
| Acquisition of intangible assets | (342,219) | (25,000) |
| Disposal of investment property | - | 48,000,000 |
| Acquisition of investment property | (164,137) | (7,421,576) |
| Acquisition of property, plant and equipment | (14,461,711) | (65,298,045) |
| (14,968,067) | (24,744,621) | |
| Lease installments paid | (20,106,664) | (14,208,050) |
| Proceeds from lease creditor | 6,000,000 | 32,175,000 |
| Proceeds from interest bearing borrowings | 2,504,093,000 | 894,436,000 |
| Repayment of interest bearing borrowings | (1,493,357,370) | (1,132,276,712) |
| Loan interest paid | (295,981,235) | (401,305,871) |
| 700,647,731 | (621,179,633) | |
| 1,990,515,034 | (650,668,760) | |
| (2,763,773,370) | (2,113,104,610) | |
| (773,258,336) | (2,763,773,370) | |
| Note A | ||
| Short-term deposit | 27,283,134 | - |
| Cash in hand | 1,669,117 | 43,420,620 |
| Cash at bank | 143,589,461 | 169,708,351 |
| Bank overdraft | (2,936,315,082) | (2,326,233,581) |
| (2,763,773,370) | (2,113,104,610) | |
| Note B | ||
| Short-term deposit | 182,540,341 | 27,283,134 |
| Cash in hand | 89,472,624 | 1,669,117 |
| Cash at bank | 104,786,483 | 143,589,461 |
| Bank overdrafts | (1,150,057,784) | (2,936,315,082) |
| (773,258,336) | (2,763,773,370) |
Figures in brackets indicate deductions.
The accounting policies and notes on pages 95 to 132 form an integral part of these financial statements.
Colombo
22nd July 2021
Prime Lands Residencies PLC (“the Company”) is a public limited liability company, incorporated on 15th September 2008 in Sri Lanka under the Companies Act No. 07 of 2007 (“the Act”) as a private limited liability company, and was converted to a public limited liability company with effect from 12th February 2021 in accordance with the provisions of the Act. Ordinary shares of the Company have been listed on the Colombo Stock Exchange with effect from 08th June 2021. The Company changed its name from “Prime Lands Residencies Limited” to “Prime Lands Residencies PLC” with effect from 17th July 2021. The registered office and principal place of business is situated at No. 75, D.S. Senanayake Mawatha, Colombo 08.
The statement of financial position, statement of comprehensive income, changes in equity and statement of cash flows, together with accounting policies and notes (“Financial Statements”) of Prime Lands Residencies PLC as at 31st March 2021 and for the year then ended, comply with the Sri Lanka Accounting Standards (hereinafter referred to as SLFRS/LKAS) effective from 01st April 2019 issued by the Institute of Chartered Accountants of Sri Lanka (CA Sri Lanka) and in compliance with the requirements of the Companies Act No. 07 of 2007 and Sri Lanka Accounting and Auditing Standards Act No. 15 of 1995.
For all period up to and including the year ended 31st March 2020, the Company prepared its financial statements in accordance with Sri Lanka Accounting Standard for Small and Medium-sized Entities (SLFRS for SMEs) effective up to 31st March 2020.
These financial statements for the year ended 31st March 2021 are the first set of financial statements prepared by the Company in accordance with SLFRS/LKAS (effective for the year beginning on or after 01st April 2019).
Note 3.23 discloses the impact of the transition to SLFRS/LKAS on the Company’s reported financial position including the nature and effect of significant change in accounting policies from those used in Company’s financial statements for the year ended 31st March 2020, prepared under SLFRS for SMEs.
The Financial Statements of Prime Lands Residencies PLC for the year ended 31st March 2021 were authorized for issue on 22nd July 2021 in accordance with a resolution of the Board of Directors.
| Item | Basis of measurement | Note number |
|---|---|---|
| Investment property | Measured at cost at the time of acquisition and subsequently at revalued amounts which are the fair values at the date of valuation | 3.7 |
| Financial assets classified as fair value through profit or loss | Measured at fair value | 3.2.3 |
Items included in these financial statements are measured using the currency of the primary economic environment in which the Company operates (the functional currency), which is the Sri Lanka Rupee.
These financial statements are presented in Sri Lanka Rupees (Rs.). All financial information presented have been rounded to the nearest rupee except where it is otherwise indicated as permitted by the Sri Lanka Accounting Standard – LKAS 01 on “Presentation of Financial Statements”.Financial assets and financial liabilities are offset and the net amount reported in the statement of financial position, only when there is a legally enforceable right to offset the recognized amounts and there is an intention to settle on a net basis or to realize the assets and settle the liabilities simultaneously. Income and expenses are not offset in the income statement, unless required or permitted by Sri Lanka Accounting Standard and as specially disclosed in the Significant Accounting Policies of the Company.
The preparation of the Financial Statements of the Company in conformity with SLFRS/LKAS requires the management to make judgments, estimates and assumptions, which may affect the amounts of income, expenditure, assets, liabilities and the disclosure of contingent liabilities, at the end of the reporting period. In the process of applying the Company’s accounting policies, key assumptions were made relating to the future and the sources of estimation at the reporting date together with the related judgments that have a significant risk of causing a material adjustment to the carrying amounts of assets and liabilities within the next financial year. Actual results may differ from these estimates.
Accounting judgments, estimates and underlying assumptions are reviewed on an ongoing basis. Revisions to accounting estimates are recognized in the year in which the estimates are revised and in any future periods affected.
Information about critical judgments, estimates and assumptions in applying the accounting policies that have the most significant effect on the amounts recognized in the financial statements are included in the following notes to these financial statements.
| Critical accounting estimate / judgement | Disclosure note |
|---|---|
| Going concern | 2.9 |
| Fair value of financial instruments | 3.2.10 |
| Useful life of property, plant and equipment | 3.3.3 |
| Useful life of intangible assets | 3.5.1 |
| Retirement benefit obligations | 3.11.2 |
| Impairment losses on financial assets | 3.2.6 |
| Provision for liabilities, commitment and contingencies | 3.18 |
| Net realizable value of inventory | 3.8 |
Impact of COVID-19 pandemic
The evolving COVID – 19 pandemic and its implications have increased the uncertainty of estimates made in preparation of the Financial Statements. The estimation uncertainty is associated with:
The significant accounting estimates impacted by these forecasts and associated uncertainties are related to expected credit losses and recoverable amount assessments of non-financial assets, recoverable value of property, plant and equipment and net realizable value of inventory.
The impact of COVID-19 pandemic on accounting estimates is discussed under the relevant notes to these Financial Statements.
The Board of Directors of the Company evaluated the appropriateness of using the going concern assumption in preparing the Financial Statements for the year ended 31st March 2021 based on the available information. In this exercise, the Board evaluated a number of scenarios prepared by the management under different assumptions which took into account the existing and anticipated effects of COVID-19 on the Company.
When preparing the Financial Statements based on the available information, the management has assessed the impact of COVID 19 and the appropriateness of the use of the going concern basis. The Board of Prime Lands Residencies PLC is satisfied that the Company has adequate resources to continue operations without any disruption for the foreseeable future, and therefore preparing and presenting these Financial Statements on a going concern basis.
Transactions in foreign currencies are translated to the respective functional currency, the Sri Lanka Rupee (Rs.), at exchange rates at the dates of the transactions.
Monetary assets and liabilities denominated in foreign currencies at the reporting date are re-translated to the functional currency at the spot rate of exchange at that date. The foreign currency gain or loss on monetary items is the difference between the amortized cost in the functional currency at the beginning of the year, adjusted for effective interest and payments during the year, and the amortised cost in foreign currency translated at the exchange rate at the end of the year.
Non-monetary assets and liabilities denominated in foreign currencies that are measured at fair value are re-translated to the functional currency at the exchange rate at the date that the fair value was determined. Non-monetary items in a foreign currency that are measured in terms of historical cost are translated using the exchange rate at the date of the transaction.
Foreign currency differences arising on re- translation are recognized in the Statement of Comprehensive Income.
On initial recognition, a financial asset is classified as measured at: amortised cost, fair value through other comprehensive income (FVTOCI) or fair value through profit or loss (FVTPL).
A financial asset is measured at amortised cost if it meets both of the following conditions and is not designated as at FVTPL:
A debt instrument is measured at FVTOCI only if it meets both of the following conditions and is not designated as at FVTPL:
On initial recognition of an equity investment that is not held for trading, the Company may irrevocably elect to present subsequent changes in fair value in OCI. This election is made on an investment by investment basis. All other financial assets are classified as measured at FVTPL.
In addition, on initial recognition, the Company may irrevocably designate a financial asset that otherwise meets the requirements to be measured at amortised cost or at FVOCI as at FVTPL if doing so eliminates or significantly reduces an accounting mismatch that would otherwise arise.
Financial assets that are held for trading or managed and whose performance is evaluated on a fair value basis are measured at FVTPL because they are neither held to collect contractual cash flows nor held both to collect contractual cash flows and to sell financial assets.
For the purposes of this assessment, ‘principal’ is defined as the fair value of the financial asset on initial recognition. ‘Interest’ is defined as consideration for the time value of money and for the credit risk associated with the principal amount outstanding during a particular period of time and for other basic lending risks and costs (e.g. liquidity risk and administrative costs), as well as a profit margin.
In assessing whether the contractual cash flows are solely payments of principal and interest, the Company considers the contractual terms of the instrument. This includes assessing whether the financial asset contains a contractual term that could change the timing or amount of contractual cash flows as such that it would not meet this condition. In making this assessment, the Company considers:
A prepayment feature is consistent with the solely payments of principal and interest criterion if the prepayment amount substantially represents unpaid amounts of principal and interest on the principal amount outstanding, which may include reasonable additional compensation for early termination of the contract. Additionally, for a financial asset acquired at a discount or premium to its contractual paramount, a feature that permits or requires prepayment at an amount that substantially represents the contractual par amount plus accrued (but unpaid) contractual interest (which may also include reasonable additional compensation for early termination) is treated as consistent with this criterion if the fair value of the prepayment feature is insignificant at initial recognition.
Equity investments at FVTOCI
Financial assets are classified appropriately as financial assets recognised through profit or loss, financial assets measured at fair value through other comprehensive income and financial assets at amortised cost.
All the financial assets are recognised at fair value at its initial recognition.
A financial asset shall be measured at amortised cost if both of the following conditions are met:
Financial assets at amortised cost of the Company comprise the followings,
Financial assets measured at fair value through other comprehensive income (FVTOCI) are non-derivative financial assets that are designated FVTOCI and that are not classified in any of the previous categories of financial assets. FVTOCI are recognised initially at fair value plus any directly attributable transaction costs.
Subsequent to initial recognition, these are measured at fair value and changes therein, other than impairment losses are recognised in other comprehensive income and presented within equity in the fair value reserve. When an investment in debt instrument is de-recognised, the cumulative gain or loss in other comprehensive income is transferred to profit or loss.Cash and cash equivalents comprise cash in hand and cash at banks and other highly liquid financial assets which are held for the purpose of meeting short-term cash commitments with original maturities of less than three months which are subject to insignificant risk of changes in their fair value.
Bank overdrafts that are repayable on demand and form an integral part of the Company cash management are included as a component of cash and cash equivalents for the purpose of the statement of cash flows.
The Company initially recognises debt securities and borrowings on the date that they are originated. All other financial liabilities are recognised initially on the trade date, which is the date that the Company becomes a party to the contractual provisions of the instruments.
The Company de-recognizes a financial liability when its contractual obligations are discharged, cancelled or expired.
The Company classifies non-derivative financial liabilities into the other financial liabilities category. Such financial liabilities are recognised initially at fair value plus
any directly attributable transaction cost. Subsequent to initial recognition, these financial liabilities are measured at amortised cost using effective interest rate method.
Financial liabilities comprise;
The Company classifies financial liabilities, other than financial guarantees and loan commitments, into one of the following categories:
A financial liability is measured initially at fair value plus, transaction costs that are directly attributable to its acquisition or issue. Subsequent measurement of financial liability is at fair value or amortised cost. The amortised cost of a financial liability is the amount at which the financial liability is measured at initial recognition, minus principal repayments, plus or minus the cumulative amortization using the effective interest method of any difference between the initial amount and the maturity amount.
The subsequent measurement of financial liabilities depends on their classification.
Financial liabilities issued by the Company that are not designated at fair value through profit or loss are recognised initially at fair value plus any directly attributable transaction costs, by taking into account any discount or premium on acquisition and fees or costs that are an integral part of the effective interest rate. Subsequent to initial recognition these financial liabilities are measured at amortised cost using the effective interest method.
The effective interest rate amortisation is included in “Interest Expense” in the statement of profit or loss. Gains and losses too are recognised in the income statement when the liabilities are de- recognised as well as through the effective interest rate amortization process.
The Company recognizes a loss allowance for Expected Credit Losses (ECLs) on financial assets measured at amortized cost or at fair value through other comprehensive income. The Company, at each reporting date measures the loss allowance for a financial instrument at an amount equal to the lifetime expected credit losses if the credit risk on that financial instrument has increased significantly since the initial recognition.
For trade and other receivables, the Company applies a simplified approach in calculating ECLs. Therefore, the Company does not track changes in credit risk, but instead recognizes a loss allowance based on lifetime ECLs at each reporting date.
A financial asset (or, where applicable a part of a financial asset or part of a group of similar financial assets) is de-recognized when:
When the Company has transferred its rights to receive cash flows from an asset or has entered into a pass– through arrangement and has neither transferred nor retained substantially all the risks and rewards of the asset nor transferred control of the asset, the asset is recognised to the extent of the Company’s continuing involvement in the asset. In that case, the Company also recognises an associated liability.
The transferred asset and the associated liability are measured on a basis that reflects the rights and obligations that the Company has retained. Continuing involvement that takes the form of a guarantee over the transferred asset is measured at the lower of the original carrying amount of the asset and the maximum amount of consideration that the Company could be required to repay.
A financial liability is de-recognised when the obligation under the liability is discharged or cancelled or expires. Where an existing financial liability is replaced by another from the same lender on substantially different terms, or the terms of an existing liability are substantially modified, such an exchange or modification is treated as de-recognition of the original liability and the recognition of a new liability. The difference between the carrying value of the original financial liability and the consideration paid is recognised in profit or loss.
The fair value of financial instruments that are traded in active markets at each reporting date is determined by reference to quoted market prices or dealer price quotations (bid price for long positions and ask price for short positions), without any deduction for transaction costs. For financial instruments not traded in an active market, the fair value is determined using the appropriate valuation techniques. Such techniques may include using the recent arm’s length market transactions; reference to the current fair value of another instrument that is substantially the same, a discounted cash flow analysis or other valuation models. An analysis of fair values of financial instruments and further details as to how they are measured are provided in the notes.
Items of property, plant and equipment are measured at cost less accumulated depreciation and any accumulated impairment losses.
Purchased software that is integral to the functionality of the related equipment is capitalized as part of that equipment.
If significant parts of an item of property or equipment have different useful lives, then they are accounted for as separate items (major components) of property and equipment.
Any gain or loss on disposal of an item of property and equipment (calculated as the difference between the net proceeds from disposal and the carrying amount of the item) is recognised within other income in profit or loss.
Depreciation is calculated to write off the cost of items of property and equipment less their estimated residual values using the straight-line method over their estimated useful lives, and is generally recognised in profit or loss. Leased assets are depreciated over the shorter of the lease term and their useful lives unless it is reasonably certain that the Company will obtain ownership by the end of the lease term. Land is not depreciated.
The estimated useful lives of significant items of property, plant and equipment are as follows:
| Type of assets | Year |
|---|---|
| Computer and equipment | 05 years |
| Motor vehicle | 04 years |
| Office equipment | 04 years |
| Plant and machinery | 04 years |
| Furniture and fittings | 04 years |
The carrying amount of an item of property, plant and equipment is de- recognized on disposal or when no future economic benefits are expected from its use or disposal. The gain or loss arising from de-recognition of an item of property, plant and equipment is included in profit or loss when the item is de-recognised.
When replacement costs are recognised in the carrying amount of an item of property, plant and equipment, the remaining carrying amount of the replaced part is de-recognised.
The Company recognizes a right-of-use asset and a lease liability at the lease commencement date. The right-of-use asset is initially measured at cost, which comprises the initial amount of the lease liability adjusted for any lease payments made at or before the commencement date, plus any initial direct costs incurred and an estimate of costs to dismantle and remove the underlying asset or to restore the underlying asset or the site on which it is located, less any lease incentives received.
The right-of-use asset is subsequently depreciated using the straight-line method from the commencement date to the end of the lease term, unless the lease transfers ownership of the underlying asset to the Company by the end of the lease term or the cost of the right-of-use asset reflects that the Company will exercise a purchase option. In that case the right-of-use asset will be depreciated over the useful life of the underlying asset, which is determined on the same basis as those of property and equipment. In addition, the right-of-use asset is periodically reduced by impairment losses, if any, and adjusted for certain remeasurements of the lease liability.
At the commencement or on modification of a contract that contains a lease component, the Company allocates the consideration in the contract to each lease component on the basis of its relative stand-alone prices.
The lease liability is initially measured at the present value of the lease payments that are not paid at the commencement date, discounted using the interest rate implicit in the lease or, if that rate cannot be readily determined, the Company’s incremental borrowing rate. Generally, the Company uses its incremental borrowing rate as the discount rate.
The Company determines its incremental borrowing rate by obtaining interest rates from debt financing arrangements at the inception of the lease period.
The lease liability is measured at amortized cost using the effective interest method. It is remeasured when there is a change in future lease payments arising from a change in an index or rate.
At inception or on modification of a contract that contains a lease component, the Company allocates the consideration in the contract to each lease component on the basis of their relative standalone prices.
When the Company acts as a lessor, it determines at lease inception whether each lease is a finance lease or an operating lease.
The Company recognizes lease payments received under operating leases as income on a straight-line basis over the lease term as part of “other income”.
Generally, the accounting policies applicable to the Company as a lessor in the comparative year are not different from SLFRS 16.
For contracts entered into prior to 01st April 2019, the Company determined whether the arrangement was or contained a lease based on the assessment of whether;
Software acquired by the Company is measured at cost less accumulated amortization and any accumulated impairment losses.
Subsequent expenditure on software assets is capitalized only when it increases the future economic benefits embodied in the specific asset to which it relates. All other expenditure is expensed as incurred.
Software is amortised on a straight-line basis in profit or loss over its estimated useful life, from the date on which it is available for use. The estimated useful life of software is 10 years.
Amortization methods, useful lives and residual values are reviewed at each reporting date and adjusted if appropriate.The Company assesses, at each reporting date, whether there is an indication that an asset may be impaired.
If any indication exists, or when the annual impairment testing for an asset is required, the Company estimates the asset’s recoverable amount. An asset’s recoverable amount is the higher of an asset’s or CGU’s fair value less cost of disposal and its value in use. The recoverable amount is determined for an individual asset, unless the asset does not generate cash inflows that are largely independent of those from other assets or a group of assets. When the carrying amount of an asset or CGU exceeds its recoverable amount, the asset is considered impaired and is written down to its recoverable amount. In assessing the value in use, the estimated future cash flows are discounted to their present value using a pre-tax discount rate that reflects the current market assessments of the time value of money and the risks specific to the asset. In determining the fair value less costs to sell, an appropriate valuation model is used. These calculations are collaborated by valuation multiples or other available fair value indicators.
Impairment losses of continuing operations are recognized in the Statement of Profit or Loss in those expense categories consistent with the function of the impaired asset, except for property previously revalued where the revaluation was taken to equity. In this case the impairment is also recognized in equity up to the amount of any previous revaluation.
For assets, an assessment is made at each reporting date as to whether there is any indication that previously recognized impairment losses may no longer exist or may have decreased. If such indication exists, the Company makes an estimate of the recoverable amount. A previously recognized impairment loss is reversed only if there has been a change in the estimates used to determine the asset’s recoverable amount since the last impairment loss was recognized. If that is the case, the carrying amount of the asset is increased to its recoverable amount. That increased amount cannot exceed the carrying amount that would have been determined, net of depreciation, had no impairment loss been recognized for the asset in prior years. Such reversal is recognized in the Statement of Profit or Loss unless the asset is carried at revalued amount, in which case, the reversal is treated as a revaluation increase.
Investment property is property held either to earn rental income or for capital appreciation or for both, but not for sale in the ordinary course of business, used in the production or supply of goods or services or for administrative purposes.
Transfers are made to investment property when, and only when, there is a change in use, evidenced by the end of owner occupation, commencement of an operating lease to another party or completion of construction or development.
Transfers are made from investment property when, and only when, there is a change in use, evidenced by the commencement of owner occupation or commencement of development with a view to sale.
For a transfer from investment property to owner occupied property or inventories, the deemed cost of property for subsequent accounting is its fair value. If the property occupied by the Company as an owner-occupied property becomes an investment property, the Company, accounts for such property in accordance with the policy stated under property, plant and equipment up to the date of change in use.
Property acquired or being constructed for sale in the ordinary course of business, rather than to be held for rental or capital appreciation, and completed properties are shown as inventories and measured at the lower of cost and net realizable value.
Cost includes:
Non-refundable commissions paid to sales or marketing agents on the sale of real estate units are expensed when paid.
Net realizable value is the estimated selling price in the ordinary course of the business, based on market prices at the reporting date and discounted for the time value of money if material, less costs to completion and the estimated costs of sale. The cost of inventory recognized in profit or loss on disposal is determined with reference to the costs incurred on the property sold and an allocation of costs based on the gross floor area of the property developed.Gratuity is a Defined Benefit Plan. The liability recognized in the statement of financial position in respect of defined benefit plan is the present value of the defined benefit obligation at the statement of financial position date. The defined benefit obligation is calculated annually by independent actuaries, using projected unit credit method, as recommended by LKAS 19 employee benefit. The present value of the defined benefit obligation is determined by discounting the estimated future cash outflows using interest rates that apply to the currency in which the benefits will be paid, and that have terms to maturity approximating to the terms of the related liability. The assumptions based on which the results of the actuarial valuation were determined are included in the note 22 to the financial statements. This liability is not externally funded and the item is grouped under non-current liabilities in the statement of financial position.
The Company recognizes all actuarial gains and losses arising from defined benefit plans in other comprehensive income and expenses related to defined benefit plans in staff expenses in the statement of profit or loss.
According to the payment of the Gratuity Act No.12 of 1983, the liability for gratuity payment to an employee arises only after the completion of 5 years of continued service.
Short-term employee benefits are expensed as the related service is provided. A liability is recognised for the amount expected to be paid if the Company has a present legal or constructive obligation to pay this amount as a result of past service provided by the employee and the obligation can be estimated reliably.
The Company is in the business of real estate and providing related services. Revenue from contracts with customers is recognized when the control of the goods or services is transferred to the customer at an amount that reflects the consideration to which the Company expects to be entitled in exchange for those goods or services. Timing of transferring the goods and services to the customer is determined based on judgments taking into consideration of the nature of the goods and services that offers to the customers.
The following specific criteria are used for the purpose of recognition of revenue:
The sale of completed property is generally expected to be the single performance obligation and the Company has determined that it will be satisfied at the point in time when the control is transferred. For unconditional exchange of contracts, this is generally expected to be when legal title is transferred to the customer. For conditional exchanges, this is expected to be when all significant conditions are satisfied. The determination of transfer of control for both unconditional and conditional exchanges are not expected to change upon the adoption of SLFRS 15.
For contracts relating to the sale of properties under development, the Company is responsible for the overall management of the project and identifies various goods and services to be provided, including design work, procurement of materials, site preparation and foundation pouring, framing and plastering, mechanical and electrical work, installation of fixtures and finishing work. In such contracts, the Company has determined that the goods and services are not distinct and will generally account for them as a single performance obligation. Depending on the terms of each contract, the Company will determine whether control is transferred at a point in time or over time:
For each performance obligation satisfied over time, the Company recognizes the revenue over time by measuring the progress towards a complete satisfaction of that performance obligation. For sale of properties under development, the Company expects to continue recognizing revenue over time because it expects that control will be transferred over time. Generally, its performance does not create an asset with alternative use to the Company and the Company has concluded that it has an enforceable right to payment for performance completed to date. As a result, no material adjustment is expected on transition to SLFRS 15 for those contracts currently recognized over time.
Expenses are recognised in the statement of comprehensive income on the basis of a direct association between the cost incurred and the earning of specific items of income. All expenditure incurred in the running of the business and in maintaining the property, plant and equipment in a state of efficiency have been charged to income in arriving at the profit for the year.
For the presentation of the statement of comprehensive income, the directors are of the opinion that the nature of the expenses method present fairly the element of the Company’s performance, and hence, such presentation method is adopted.
Borrowing costs directly attributable to the acquisition or construction of an asset that necessarily takes a substantial period of time to get ready for its intended use or sale are capitalized as part of the cost of the respective assets. All other borrowing costs and borrowing costs incurred after the completion of the underlying construction are expensed in the period in which they occur. Borrowing costs consist of interest and other costs that an entity incurs in connection with the borrowing of funds.
Income tax expense comprises current and deferred tax. It is recognized in profit or loss except to the extent that it relates to items recognized directly in equity or in OCI.
Income tax provisions for the year ended 31st March 2021 have been made as per the provision of the Inland Revenue Act No. 24 of 2017 and the amendments thereto.
Current tax comprises the expected tax payable or receivable on the taxable income or loss for the year and any adjustment to the tax payable or receivable in respect of previous years. The amount of current tax payable or receivable is the best estimate of the tax amount expected to be paid or received that reflects uncertainty related to income taxes, if any. The tax rates and tax laws used to compute the amount are those that are enacted or substantively enacted at the reporting date. Current tax assets and liabilities are offset only if certain criteria are met.
Current tax relating to items recognized directly in equity is recognized in equity and not in the statement of profit or loss. Management periodically evaluates positions taken in the tax returns with respect to situations in which applicable tax regulations are subject to interpretation and establishes provisions where appropriate.
Deferred tax is recognized in respect of temporary differences between the carrying amounts of assets and liabilities for financial reporting purposes and the amounts used for taxation purposes.
Deferred tax is not recognized for:
Deferred tax is measured at the tax rates that are expected to be applied to temporary differences when they reverse, based on the laws that have been enacted or substantively enacted by the reporting date.
Deferred tax assets and liabilities are offset if there is a legally enforceable right to offset the current tax liabilities and assets, and they relate to income taxes levied
by the same tax authority on the same taxable entity, or on different tax entities, but they intend to settle the current tax liabilities and assets on a net basis or their tax assets and liabilities will be realized simultaneously.
A deferred tax asset is recognized for unused tax losses, tax credits and deductible temporary differences, to the extent that it is probable that future taxable profits will be available against which they can be utilized. Deferred tax assets are reviewed at each reporting date and are reduced to the extent that it is no longer probable that the related tax benefit will be realized. Deferred tax assets and liabilities are not discounted.
The net increase in the carrying amount of deferred tax liability net of deferred tax asset is recognized as deferred tax expense and conversely any net decrease is recognized as reversal to deferred tax expense, in the statement of comprehensive income.
Stated capital consists solely of ordinary share capital. Ordinary shares are classified as equity.
Incremental costs directly attributable to the issue of new shares other than on a business combination, are shown as a deduction, net of tax, in equity from the proceeds.
Dividends on ordinary shares are recognised in equity in the period in which they are approved by the Company’s shareholders.
Contingent liabilities are possible obligations whose existence will be confirmed only by uncertain future events or present obligations where the transfer of economic benefit is not probable or cannot be readily measured as defined in the Sri Lanka Accounting Standard- LKAS 37 on ‘Provisions, Contingent Liabilities and Contingent Assets’. Contingent Liabilities are not recognized in the statement of financial position but are disclosed unless its occurrence is remote.
Details of the commitments and contingencies are given in note 30 to the financial statements.
Events after the reporting period are those events, favorable and unfavorable, that occur between the reporting date and the date the Financial Statements are authorised for issue.
All material and important events that occurred after the reporting date have been considered and appropriate disclosures are made in Note 35 to the Financial Statements.
Comparative information including quantitative, narrative and descriptive information is disclosed in respect of the previous year in the Financial Statements in order to enhance the understanding of the current year’s Financial Statements and to enhance the inter period comparability. The presentation and classification of the Financial Statements of the previous year are amended where relevant, for better presentation and to be comparable with those of the current year.
The Company remeasured and adjusted certain financial statement line items as disclosed in Note 3.23, on adoption of SLFRS/LKAS for the first time during the year.
The new and amended standards and interpretations that are issued, but not yet effective, up to the date of issuance of the Company’s financial statements are disclosed below.
The Company intends to adopt this amended standard and interpretation, if applicable, when it becomes effective.
As a result of the COVID19 pandemic, rent concessions have been granted to lessees. Such concessions might take a variety of forms, including payment holidays and deferral of lease payments. According to the amendment to SLFRS 16 Leases, the lessees are provided with an option to treat qualifying rent concessions in the same way as they would if they were not lease modifications. In many cases, this will result in accounting for the concessions as variable lease payments in the period in which they are granted. Entities applying the practical expedients must disclose this fact, whether the expedient has been applied to all qualifying rent concessions or, if not, information about the nature of the contracts to which it has been applied, as well as the amount recognized in profit or loss arising from the rent concessions.
The amendment applies to annual reporting periods beginning on or after 01 June 2020.
These financial statements, for the year ended 31st March 2021, are the first set of financial statements, the Company has prepared in accordance with SLFRS/ LKAS. For year up to and including the year ended 31st March, 2020, the Company prepared its financial statements in accordance with SLFRS for SMEs.
Accordingly, the Company has prepared financial statements which comply with SLFRS/LKAS applicable for the year ended on 31st March 2021, together with the comparative year data as at and for the year ended 31st March 2020, as described in the accounting policies. In preparing these financial statements, the Company’s opening statement of financial position was prepared as at 01st April 2019, the Company’s date of transition to SLFRS/ LKAS. This note explains the principal adjustments made by the Company in restating its SLFRS for SMEs statement of financial position as at 01st April 2019 and its previously published SLFRS for SMEs financial statements as at and for the year ended 31st March 2020.
| As at 31st March 2020 | As at 31st March 2019 | ||||||
|---|---|---|---|---|---|---|---|
Statement of financial position | Note | SLFRS for SMEs Rs. | Remeasurements / Re-classifications Rs. | SLFRS/ LKAS Rs. | SLFRS for SMEs Rs. | Remeasurements / Re-classifications Rs. | SLFRS/ LKAS Rs. |
| Property, plant and equipment | A | 111,929,881 | (97,290,811) | 14,639,070 | 76,088,813 | (63,788,271) | 12,300,542 |
| Right-of-use assets | - | 97,290,811 | 97,290,811 | - | 63,788,271 | 63,788,271 | |
| Investment property | 653,000,000 | - | 653,000,000 | 689,000,000 | - | 689,000,000 | |
| Intangible assets | 166,027 | - | 166,027 | 161,665 | - | 161,665 | |
| Financial assets at amortized cost | 270,194,898 | - | 270,194,898 | 269,724,650 | - | 269,724,650 | |
| 1,035,290,806 | - | 1,035,290,806 | 1,034,975,128 | - | 1,034,975,128 | ||
| Inventory properties | 8,505,835,575 | - | 8,505,835,575 | 10,268,673,606 | - | 10,268,673,606 | |
| Financial assets - FVTPL | 180,000 | - | 180,000 | 208,500 | - | 208,500 | |
| Advance paid for contractors | 3,807,469,438 | - | 3,807,469,438 | 2,274,705,470 | - | 2,274,705,470 | |
| Advances, deposits and other receivables | 61,442,854 | - | 61,442,854 | 94,275,000 | - | 94,275,000 | |
| Income tax recoverable | - | - | - | 4,478,359 | - | 4,478,359 | |
| Cash and cash equivalents | C | 172,541,712 | - | 172,541,712 | 213,128,971 | - | 213,128,971 |
| 12,547,469,579 | - | 12,547,469,579 | 12,855,469,906 | - | 12,855,469,906 | ||
| 13,582,760,385 | - | 13,582,760,385 | 13,890,445,034 | - | 13,890,445,034 | ||
| Stated capital | 1,500,000,000 | - | 1,500,000,000 | 1,500,000,000 | - | 1,500,000,000 | |
| Retained earnings | B / D | 937,121,042 | 5,596,544 | 942,717,586 | 1,212,512,367 | 4,944,252 | 1,217,456,619 |
| 2,437,121,042 | 5,596,544 | 2,442,717,586 | 2,712,512,367 | 4,944,252 | 2,717,456,619 | ||
| Employee benefit | B | 18,979,453 | (5,793,071) | 13,186,382 | 16,621,424 | (4,944,252) | 11,677,172 |
| Interest - bearing loans and borrowings | 1,589,086,191 | - | 1,589,086,191 | 2,551,769,163 | - | 2,551,769,163 | |
| Lease liabilities | 48,270,500 | - | 48,270,500 | 26,870,169 | - | 26,870,169 | |
| Deferred tax liabilities | B / D | 21,239,423 | 196,527 | 21,435,950 | 14,543,272 | - | 14,543,272 |
| 1,677,575,567 | (5,596,544) | 1,671,979,023 | 2,609,804,028 | (4,944,252) | 2,604,859,776 | ||
| Trade and other payables | 497,324,507 | - | 497,324,507 | 504,895,748 | - | 504,895,748 | |
| Amount due to related party | 5,966,006 | - | 5,966,006 | 4,681,229 | - | 4,681,229 | |
| Amount due to directors | 391,000,000 | - | 391,000,000 | - | - | - | |
| Interest - bearing loans and borrowings | 1,593,957,546 | - | 1,593,957,546 | 869,115,286 | - | 869,115,286 | |
| Lease liabilities | 9,383,560 | - | 9,383,560 | 4,031,557 | - | 4,031,557 | |
| Customer advance collection | 3,915,371,098 | - | 3,915,371,098 | 4,859,171,238 | - | 4,859,171,238 | |
| Income tax payable | 118,745,977 | - | 118,745,977 | - | - | - | |
| Bank overdraft | 2,936,315,082 | - | 2,936,315,082 | 2,326,233,581 | - | 2,326,233,581 | |
| 9,468,063,776 | - | 9,468,063,776 | 8,568,128,639 | - | 8,568,128,639 | ||
| 11,145,639,343 | (5,596,544) | 11,140,042,799 | 11,177,932,667 | (4,944,252) | 11,172,988,415 | ||
| 13,582,760,385 | - | 13,582,760,385 | 13,890,445,034 | - | 13,890,445,034 | ||
| For the year ended 31st March 2020 | For the year ended 31st March 2019 | ||||||
|---|---|---|---|---|---|---|---|
Statement of Comprehensive Income | Note | SLFRS for SMEs Rs. | Remeasurements / Re-classifications Rs. | SLFRS/ LKAS Rs. | SLFRS for SMEs Rs. | Remeasurements / Re-classifications Rs. | SLFRS/ LKAS Rs. |
| Revenue | 5,716,288,413 | - | 5,716,288,413 | 3,595,043,841 | - | 3,595,043,841 | |
| Cost of sales | (4,643,344,148) | - | (4,643,344,148) | (2,712,702,942) | - | (2,712,702,942) | |
| 1,072,944,265 | - | 1,072,944,265 | 882,340,899 | - | 882,340,899 | ||
| Other income | C | 15,222,371 | - | 15,222,371 | 22,183,548 | - | 22,183,548 |
| Gain on fair value of investment property | 4,578,424 | - | 4,578,424 | 197,819,765 | - | 197,819,765 | |
| Distribution expenses | (29,779,794) | - | (29,779,794) | (22,292,447) | - | (22,292,447) | |
| Administrative expenses | B / C | (268,582,576) | (133,814) | (268,716,390) | (237,509,554) | 4,944,252 | (232,565,302) |
| 794,382,690 | (133,814) | 794,248,876 | 842,542,211 | 4,944,252 | 847,486,463 | ||
| Finance income | C | 27,302,208 | 27,302,208 | 52,798,162 | - | 52,798,162 | |
| Finance expenses | C | (639,767,576) | - | (639,767,576) | (621,667,701) | - | (621,667,701) |
| 181,917,322 | (133,814) | 181,783,508 | 273,672,672 | 4,944,252 | 278,616,924 | ||
| Tax expenses | D | (50,987,616) | - | (50,987,616) | (15,611,147) | - | (15,611,147) |
| 130,929,706 | (133,814) | 130,795,892 | 258,061,525 | 4,944,252 | 263,005,777 | ||
| Actuarial gain on retirement benefit obligation | B | - | 982,633 | 982,633 | - | - | - |
| Tax on other comprehensive income | B | - | (196,527) | (196,527) | - | - | - |
| - | 786,106 | 786,106 | - | - | - | ||
| 130,929,706 | 652,292 | 131,581,998 | 258,061,525 | 4,944,252 | 263,005,777 | ||
| For the year ended 31.03.2021 Rs. | For the year ended 31.03.2020 Restated Rs. |
|||
| Revenue | 7,742,210,770 | 5,725,161,095 | ||
| Less: Rebates | (9,812,636) | (8,872,682) | ||
| 7,732,398,134 | 5,716,288,413 | |||
| For the year ended 31.03.2021 Rs. | For the year ended 31.03.2020 Restated Rs. |
|||
| Rent income | 12,000,000 | 120,000 | ||
| Fair value gain on investments in quoted shares | 15,000 | - | ||
| Legal fee income | 14,076,431 | 15,102,371 | ||
| 26,091,431 | 15,222,371 | |||
| For the year ended 31.03.2021 Rs. | For the year ended 31.03.2020 Restated Rs. |
|||
| Interest income | 27,783,138 | 23,215,477 | ||
| Foreign exchange gain | 73,605,984 | 4,086,731 | ||
| Late payment fee | 3,352,109 | - | ||
| 104,741,231 | 27,302,208 | |||
| Bank loan charges | 1,762,010 | 783,825 | ||
| Loan interest | 295,981,235 | 401,305,871 | ||
| Lease interest | 10,644,856 | 8,785,384 | ||
| Overdraft interest | 103,975,413 | 214,664,259 | ||
| Exchange loss on investments in debenture | - | 14,228,237 | ||
| 412,363,514 | 639,767,576 | |||
| For the year ended 31.03.2021 Rs. | For the year ended 31.03.2020 Restated Rs. |
|||
| Directors' remuneration | 72,000,000 | 24,000,000 | ||
| Staff salaries, bonus, allowances and incentives | 96,309,035 | 114,679,519 | ||
| Defined contribution plan costs - EPF and ETF | 11,926,293 | 14,819,806 | ||
| Depreciation and amortization | 37,458,336 | 29,477,615 | ||
| Fair value loss on investment in quoted shares | - | 28,500 | ||
| Auditors' remuneration | 1,284,900 | 907,500 | ||
| Advertising and business promotion | 16,157,469 | 20,943,902 | ||
| Provision for retirement benefit obligation | 4,101,457 | 4,054,918 | ||
Note | For the year ended 31.03.2021 Rs. | For the year ended 31.03.2020 Restated Rs. |
||
| Income tax | 8.1 | 289,161,569 | 44,291,465 | |
| Deferred tax (reversal)/provision | 25 | (999,878) | 6,696,151 | |
| 288,161,691 | 50,987,616 | |||
| Profit before taxation | 1,277,417,267 | 181,783,508 | ||
| Income considered separately | (123,592,094) | (40,536,125) | ||
| Disallowable items | 51,325,510 | 67,765,242 | ||
| Allowable items | (25,209,513) | (25,993,148) | ||
| Business income | 1,179,941,170 | 183,019,477 |
||
| Investment income | 21,546,592 | 23,335,477 | ||
| Other income | 3,352,109 | 15,102,371 | ||
| Taxable income | 1,204,839,871 | 221,457,325 | ||
| Effective tax rate | 24% | 20% | ||
| Income tax expense for the year | 289,161,569 | 44,291,465 | ||
| The basic earnings per share is calculated by dividing the net profit for the year attributable to ordinary shareholders by the weighted average number of ordinary shares outstanding during the year. | ||||
| 31.03.2021 Rs. | 31.03.2020 Restated Rs. |
|||
| Profit attributable to ordinary shareholders | 989,255,576 | 130,795,892 | ||
| Weighted average number of ordinary shares in issue | 750,000,000 | 750,000,000 | ||
| 1.32 | 0.17 | |||
| Description | Office equipment Rs. | Plant and machinery Rs. | Computers and accessories Rs. | Furniture and fittings Rs. | Motor vehicles Rs. | Electrical items Rs. | Total Rs. |
|
| 23,200 | 3,794,367 | 8,272,993 | 3,162,927 | 21,300,132 | 686,030 | 37,239,649 | ||
| Add : Additions during the year | - | - | 1,456,074 | - | 8,600,000 | 28,950 | 10,085,024 | |
| 23,200 | 3,794,367 | 9,729,067 | 3,162,927 | 29,900,132 | 714,980 | 47,324,673 | ||
| Add : Additions during the year | - | - | 1,107,296 | - | - | 1,354,415 | 2,461,711 | |
| 23,200 | 3,794,367 | 10,836,363 | 3,162,927 | 29,900,132 | 2,069,395 | 49,786,384 | ||
| 23,200 | 2,227,795 | 5,075,976 | 2,247,970 | 14,817,330 | 546,836 | 24,939,107 | ||
| Add : Depreciation for the year | - | 951,161 | 1,632,540 | 577,648 | 4,503,773 | 81,374 | 7,746,496 | |
| 23,200 | 3,178,956 | 6,708,516 | 2,825,618 | 19,321,103 | 628,210 | 32,685,603 | ||
| Add : Depreciation for the year | - | 555,327 | 1,398,704 | 230,736 | 4,963,287 | 137,411 | 7,285,465 | |
| 23,200 | 3,734,283 | 8,107,220 | 3,056,354 | 24,284,390 | 765,621 | 39,971,068 | ||
| - | 1,566,572 | 3,197,017 | 914,957 | 6,482,802 | 139,194 | 12,300,542 | ||
| - | 615,411 | 3,020,551 | 337,309 | 10,579,029 | 86,770 | 14,639,070 | ||
| - | 60,084 | 2,729,143 | 106,573 | 5,615,742 | 1,303,774 | 9,815,316 | ||
| During the year, the Company acquired property, plant and equipment to the aggregate value of Rs.2,461,711/- (2020 - Rs.10,085,024/-). Cash payments amounting to Rs.2,461,711/- (2020 - Rs.10,085,024/-) were made during the year for the acquisition of property, plant and equipment. | ||||||||
| There were no property, plant or equipment idling as at 31st March 2021 and 31st March 2020. | ||||||||
| There was no restriction on the title of property, plant and equipment as at 31st March 2021 and 31st March 2020. | ||||||||
| There were no items of property, plant and equipment pledged as securities for liabilities as at 31st March 2021 and 31st March 2020. | ||||||||
| Property, plant and equipment of the Company includes fully depreciated assets having a gross carrying value of Rs.13,050,805 ( 2020 Rs.9,500,453) | ||||||||
| As at 31.03.2021 Rs. | As at 31.03.2020 Rs. | As at 01.04.2019 Rs. |
||
Cost | ||||
| Balance at the beginning of the year | 64,225,000 | - | ||
| Add : Additions during the year | 55,213,021 | 64,225,000 | ||
| 119,438,021 | 64,225,000 | |||
| Balance at the beginning of the year | 436,729 | - | ||
| Add : Amortization for the year | 21,710,481 | 436,729 | ||
| 22,147,210 | 436,729 | |||
| 97,290,811 | 63,788,271 | |||
| Land Rs. | Building Rs. | Total Rs. |
||
| 524,000,000 | 165,000,000 | 689,000,000 | ||
| Add : Additions during the year | - | 7,421,576 | 7,421,576 | |
| Less : Transfers during the year | (48,000,000) | - | (48,000,000) | |
| Add : Fair value gain/(loss) during the year | 5,000,000 | (421,576) | 4,578,424 | |
| 481,000,000 | 172,000,000 | 653,000,000 | ||
| Add : Additions during the year | - | 164,137 | 164,137 | |
| Add : Fair value gain during the year | 6,835,863 | - | 6,835,863 | |
| Balance as at 31.03.2021 | 487,835,863 | 172,164,137 | 660,000,000 | |
| Fair value of the investment property for the purpose of disclosure in note 34.2 was ascertained by valuations carried out by independent valuers as required by LKAS 40. | ||||
| For the year ended 31.03.2021 Rs. | For the year ended 31.03.2020 Rs. |
|||
| Fair value gain during the year | 4,578,424 | |||
| 4,578,424 | ||||
| Location of the investment property | Valuer’s name and report date | Fair Value | |||
| Total extent | As at 31.03.2021 | As at 31.03.2020 | |||
| Bare Land No 123, Castle Street, Colombo 08 | R.M.N. Priyadarshani [Incorporated Valuer] - Report date : 31/01/2021 ( valid for 6 months from the date of valuation) | P 33.50 | 296,000,000 | ||
| Land & Commercial Building No. 61, D S Senanayaka Mw, Colombo 08 | R.M.N. Priyadarshani [Incorporated Valuer] - Report date : 31/01/2021 ( valid for 6 months from the date of valuation) | P 12.20 | 357,000,000 | ||
| The Company uses unobservable market input in determining the fair value of investment property (Level-3 of fair value hierarchy) | |||||
| Total Perches/ Square feet Rs. | Cost per perch Rs. | Total value Rs. |
|||
| (a) Bare Land-No 123, Castle Street, Colombo 08 | P33.5 | 9,000,000 | 301,500,000 | ||
| Fair value of the subject property for the Financial Reporting purpose | 300,000,000 | ||||
| (b) Lot A in Plan No 4751/9000 situated at Colombo 08 | |||||
| Land | P12.20 | 16,000,000 | 195,200,000 | ||
| Commercial Building No. 61, D S Senanayaka Mw,Colombo 08 | 13,427 sq.ft | 14,000 | 187,978,000 | ||
| Less: 12.5% for Depreciation | (23,497,250) | ||||
| 359,680,750 | |||||
| Fair value of the subject property for the Financial Reporting purpose | 360,000,000 | ||||
| Further details of the valuation techniques and significant unobservable input are given in note 34.2. |
|||||
| The Company has assessed the impact from COVID-19 on its assets base by way of an evaluation of the assumptions used for the valuation of investment property and identified that there is no significant impact resulting from the evaluation of market indicators. | |||||
| For the year ended 31.03.2021 Rs. | For the year ended 31.03.2020 Rs. |
||||
| Rental income earned | |||||
| Operating expenditure | 120,000 | ||||
| 212,520 | |||||
| The details of investment properties pledged as security against borrowings are disclosed in Note 31. | |||||
| As at 31.03.2021 Rs. | As at 31.03.2020 Rs. | As at 01.04.2019 Rs. |
|||
Cost | |||||
| Balance at the beginning of the year | 230,219 | 205,219 | 180,219 | ||
| Add : Additions during the year | 342,219 | 25,000 | 25,000 | ||
| 572,438 | 230,219 | 205,219 | |||
| Balance at the beginning of the year | 64,192 | 43,554 | 25,532 | ||
| Add : Amortization for the year | 34,015 | 20,638 | 18,022 | ||
| 98,207 | 64,192 | 43,554 | |||
| 474,231 | 166,027 | 161,665 | |||
| As at 31.03.2021 Rs. | As at 31.03.2020 Rs. | As at 01.04.2019 Rs. |
|||
| Balance at the beginning of the year | 270,194,898 | 269,724,650 | 77,207,391 | ||
| Add : Investments made during the year | - | - | 173,338,240 | ||
| Add : Exchange gain/(loss) for the year | 64,507,604 | (14,228,237) | 9,893,714 | ||
| Add : Interest receivable during the year | 18,236,546 | 14,698,485 | 9,285,305 | ||
| 352,939,048 | 270,194,898 | 269,724,650 | |||
| As at 31.03.2021 | As at 31.03.2020 | ||||
| Number of debentures. Rs. | Carrying amount Rs. | Number of debentures. Rs. | Carrying amount Rs. |
||
| Debt securities - unquoted debenture | 2,034 | 352,939,048 | 2,034 | 270,194,898 | |
| 2,034 | 352,939,048 | 2,034 | 270,194,898 | ||
The Company has invested in non-convertible redeemable debentures denominated in Australian Dollar (AUD) amounting to AUD 2,034,000 for a tenor of five years at an interest rate of 6% per annum as funding for operation of Prime Lands Australia (Pty) Limited.
Assets pledged as security against borrowings and the facility details are disclosed in Note 31.
| As at 31.03.2021 Rs. | As at 31.03.2020 Rs. | As at 01.04.2019 Rs. |
||
| Balance at the beginning of the year | 8,505,835,575 | 10,268,673,606 | 7,831,346,082 | |
| Add : Cost incurred during the year | 8,386,917,253 | 2,804,791,007 | 4,995,352,106 | |
| 16,892,752,828 | 13,073,464,613 | 12,826,698,188 | ||
| Less : Disposals during the year (Recognized in cost of sales) | (5,806,030,680) | (4,567,629,038) | (2,558,024,582) | |
| 11,086,722,148 | 8,505,835,575 | 10,268,673,606 | ||
The Company assessed the impact of COVID-19 on inventory properties and evaluated whether it was required to adjust the carrying value of the inventory prior to reflecting them at the lower of cost or net realizable value and concluded no significant impact had resulted from it and therefore, no adjustments were made in the carrying value of the inventory related to this.
The details of inventory properties pledged as security against borrowings are disclosed in Note 31.
Note | As at 31.03.2021 Rs. | As at 31.03.2020 Rs. | As at 01.04.2019 Rs. |
||
| Quoted equity securities | 16.1 | 195,000 | 180,000 | 208,500 | |
| 195,000 | 180,000 | 208,500 | |||
| As at 31.03.2021 | As at 31.03.2020 | ||||
| Number of shares Rs. | Fair value Rs. | Number of shares Rs. | Fair value Rs. |
||
| Mahaweli Reach Hotels PLC | 15,000 | 195,000 | 15,000 | 180,000 | |
| 15,000 | 195,000 | 15,000 | 180,000 | ||
| As at 31.03.2021 Rs. | As at 31.03.2020 Rs. | As at 01.04.2019 Rs. |
|||
| Balance at the beginning of the year | 3,807,469,438 | 2,274,705,470 | 458,033,887 | ||
| Add : Advance paid for contractors during the year | 107,550,420 | 1,641,366,512 | 2,328,300,098 | ||
| Less : Transferred to inventory properties during the year | (3,557,692,911) | (108,602,544) | (511,628,515) | ||
| 357,326,947 | 3,807,469,438 | 2,274,705,470 | |||
| As at 31.03.2021 Rs. | As at 31.03.2020 Rs. | As at 01.04.2019 Rs. |
|||
| Receivables from management corporation | 47,018,683 | 35,957,905 | 31,543,184 | ||
| ESC | - | - | 40,233,861 | ||
| WHT receivable | - | - | 1,521,579 | ||
| Security deposit | 44,800 | 44,800 | 44,800 | ||
| Staff advance | 1,624,678 | 1,535,428 | 916,803 | ||
| Other utility advance | 7,976,075 | 7,576,075 | 6,902,657 | ||
| Project advance | 16,823,136 | 15,542,646 | 12,326,116 | ||
| Refundable deposits | 3,005,001 | 786,000 | 786,000 | ||
| 76,492,373 | 61,442,854 | 94,275,000 | |||
Note | As at 31.03.2021 Rs. | As at 31.03.2020 Rs. | As at 01.04.2019 Rs. |
||
| 118,745,977 | (4,478,359) | - | |||
| Impact on adoption of IFRIC 23 | 19.1 | - | 406,321,031 | - | |
| 118,745,977 | 401,842,672 | - | |||
| Less : WHT credit | - | (566,438) | (2,114,287) | ||
| ESC claim | - | (89,882,471) | (17,975,219) | ||
| During the year payment | (110,862,296) | (236,939,251) | - | ||
| 7,883,681 | 74,454,512 | (20,089,506) | |||
| Add : Income tax refund | 163,963,992 | - | - | ||
| During the year income tax expense | 289,161,569 | 44,291,465 | 15,611,147 | ||
| 461,009,242 | 118,745,977 | (4,478,359) | |||
| The Company had assessed the impact of initial adoption of IFRIC 23 - Uncertainty over income tax treatment on the tax exemption provisions under Section 17 (A) of the Inland Revenue (Amended) Act No. 08 of 2012 for years of assessment 2015/16, 2016/17 and 2017/18 and accordingly, had determined the final tax liability of Rs. 406,321,031 for the Company as of 01st April 2019. | |||||
| As at 31.03.2021 Rs. | As at 31.03.2020 Rs. | As at 01.04.2019 Rs. |
||
| Fixed deposits | 182,540,341 | 27,283,134 | - | |
| 182,540,341 | 27,283,134 | - | ||
| Cash in hand | 15,682,108 | 1,570,117 | 6,035,263 | |
| Petty cash | 85,964 | 99,000 | 99,700 | |
| Cheques in hand | 73,704,552 | - | 37,285,657 | |
| Cash at banks | 104,786,483 | 143,589,461 | 169,708,351 | |
| 194,259,107 | 145,258,578 | 213,128,971 | ||
| 376,799,448 | 172,541,712 | 213,128,971 | ||
| Bank overdraft | 1,150,057,784 | 2,936,315,082 | 2,326,233,581 | |
| 1,150,057,784 | 2,936,315,082 | 2,326,233,581 | ||
| Cash and cash equivalents for the purpose of statement of cash flows | (773,258,336) | (2,763,773,370) | (2,113,104,610) | |
| Fixed deposits pledged as security against borrowings are disclosed in Note 31 | ||||
| As at 31.03.2021 Rs. | As at 31.03.2020 Rs. | As at 01.04.2019 Rs. |
||
| Number of shares - Ordinary shares | 750,000,000 | 150,000,000 | 150,000,000 | |
| Value - Ordinary shares (Rs.) | 1,500,000,000 | 1,500,000,000 | 1,500,000,000 | |
| The holders of ordinary shares confer their rights to receive dividends as declared from time to time and are entitled to one vote per share at the meetings of shareholders. All shares rank equally and pari pasu with regard to the Company’s residual assets. |
||||
| During the year ended 31st March 2021, the Company has subdivided its 150,000,000 fully paid Ordinary Shares, by splitting each One (01) Ordinary Share into Five (05) Shares totaling to 750,000,000 fully paid Ordinary Shares without any change to the Stated Capital of the Company. | ||||
| As at 31.03.2021 Rs. | As at 31.03.2020 Restated Rs. |
||
| Balance at the beginning of the year | 13,186,382 | 11,677,172 | |
| Amount charged/(reversed) for the year | 2,812,659 | 3,072,285 | |
| Payments made during the year | (535,200) | (1,563,075) | |
| 15,463,841 | 13,186,382 | ||
| For the year ended 31.03.2021 Rs. | For the year ended 31.03.2020 Restated Rs. |
||
| Current service cost for the year | 2,650,955 | 2,770,429 | |
| Interest cost for the year | 1,450,502 | 1,284,489 | |
| 4,101,457 | 4,054,918 | ||
| Actuarial gain for the year | (1,288,798) | (982,633) | |
| (1,288,798) | (982,633) | ||
| Messrs. Actuarial and Management Consultants (Pvt) Ltd, Actuaries, carried out an actuarial valuation of the retirement benefit obligation for Prime Lands Residencies PLC as at 31st March 2021. The valuation method used by the Actuary to value the liability is the ‘Projected Unit Credit Actuarial Cost Method’ recommended by LKAS 19. Appropriate and compatible assumptions were used in determining the cost of retirement benefits. The principal assumptions used are as follows: | |||
| Actuarial assumptions | 31.03.2021 | 31.03.2020 | |
| Discount rate | 8% | 11% | |
| Salary increment rate | 6% | 10% | |
| Staff turnover | 10% | 10% | |
| Retirement age | 55 years | 60 years | |
| Mortality | A 1967/70 Mortality Table (Institute of Actuaries, London) | ||
| The following table demonstrates the sensitivity to a reasonably possible change in the key assumptions employed with all other variables held constant in the employment benefit liability measurement. The sensitivity of the statement of financial position is the effect of the assumed changes in discount rate and salary increment rate on the profit or loss and employment benefit obligation for the year. | ||||
| 2020/2021 Rs. | 2019/2020 Rs. |
|||
| Effect on retirement benefit obligation due to 1% increase | 14,594,497 | 12,278,707 | ||
| Effect on retirement benefit obligation due to 1% increase | 16,431,911 | 14,218,048 | ||
| Effect on retirement benefit obligation due to 1% increase | 16,393,928 | 14,179,535 | ||
| Effect on retirement benefit obligation due to 1% increase | 14,613,866 | 12,296,666 | ||
| As at 31.03.2021 Rs. | As at 31.03.2020 Rs. | As at 01.04.2019 Rs. |
||
| Balance at the beginning of the year | 3,183,043,737 | 3,420,884,449 | 2,990,446,236 | |
| Loans obtained during the year | 2,504,093,000 | 894,436,000 | 1,143,998,753 | |
| 5,687,136,737 | 4,315,320,449 | 4,134,444,989 | ||
| Repayments during the year | (1,493,357,370) | (1,132,276,712) | (713,560,540) | |
| 4,193,779,367 | 3,183,043,737 | 3,420,884,449 | ||
| Repayable within one year | 1,859,837,994 | 1,593,957,546 | 869,115,286 | |
| Repayable between one & five years | 2,333,941,373 | 1,589,086,191 | 2,551,769,163 | |
| Assets pledged as security against borrowings and the facility details are disclosed in Note 31. | ||||
| As at 31.03.2021 Rs. | As at 31.03.2020 Rs. | As at 01.04.2019 Rs. |
|||
| Balance at the beginning of the year | 86,676,162 | 49,013,684 | - | ||
| Lease obtained during the year | 8,754,540 | 51,146,580 | 49,278,780 | ||
| 95,430,702 | 100,160,264 | 49,278,780 | |||
| Repayments during the year | (20,106,664) | (13,484,102) | (265,096) | ||
| 75,324,038 | 86,676,162 | 49,013,684 | |||
| Balance at the beginning of the year | 29,022,102 | 18,111,958 | - | ||
| Interest in suspense on lease obtained during the year | 2,754,540 | 18,971,580 | 18,278,624 | ||
| Charged to the statement of comprehensive income | (10,644,856) | (8,061,436) | (166,666) | ||
| 21,131,786 | 29,022,102 | 18,111,958 | |||
| 54,192,252 | 57,654,060 | 30,901,726 | |||
| Repayable within one year | 11,442,245 | 9,383,560 | 4,031,557 | ||
| Repayable between one and five years | 42,750,007 | 48,270,500 | 26,870,169 | ||
| As at 31.03.2021 Rs. | As at 31.03.2020 Restated Rs. |
||||
| Balance at the beginning of the year | 14,543,272 | ||||
| Recognized in statement of comprehensive income | 6,696,151 | ||||
| Recognized in other comprehensive income | 196,527 | ||||
| 21,435,950 | |||||
| Deferred tax (provision) / reversal for the year | |||||
| Deferred tax assets/(liabilities) are attributable to the following: | |||||
| As at 31.03.2021 | As at 31.03.2020 | ||||
| Temporary difference Rs. | Tax Rs. | Temporary difference Rs. | Tax Rs. |
||
| Employee benefits | 15,463,841 | 3,711,322 | 13,186,382 | 2,637,276 | |
| 15,463,841 | 3,711,322 | 13,186,382 | 2,637,276 | ||
| Property, plant and equipment | (47,453,734) | (11,388,896) | (58,445,012) | (11,689,002) | |
| Investment properties - Land | (130,678,103) | (13,067,810) | (123,842,240) | (12,384,224) | |
| (178,131,837) | (24,456,706) | (182,287,252) | (24,073,226) | ||
| (162,667,996) | (20,745,384) | (169,100,870) | (21,435,950) | ||
| Movement in deferred tax balance during the year | |||||
|---|---|---|---|---|---|
| Balance as at 31.03.2020 Rs. | Recognised in profit or loss Rs. | Recognised in OCI Rs | Balance as at 31.03.2021 Rs. |
||
| Employee benefits | 2,637,276 | 1,383,358 | (309,312) | ||
| Property, plant and equipment | (11,689,002) | 300,106 | - | ||
| Investment properties - Land | (12,384,224) | (683,586) | - | ||
| (21,435,950) | 999,878 | (309,312) | |||
| Deferred tax has been determined based on the effective tax rate of 24%. | |||||
Note | As at 31.03.2021 Rs. | As at 31.03.2020 Rs | As at 01.04.2019 Rs. |
||
| Accrued expenses | 26.1 | 112,203,206 | 88,889,804 | ||
| Retention payable | 363,966,501 | 388,879,385 | |||
| Payables to contractors | 21,154,800 | 21,347,359 | |||
| Land creditors | - | - | 5,779,200 | ||
| 497,324,507 | 504,895,748 | ||||
| Auditor's remuneration | 907,500 | 1,135,141 | |||
| Welfare society | 284,250 | 279,000 | |||
| Staff payable - others | 1,986,257 | 1,599,036 | |||
| EPF | 1,536,427 | 1,772,281 | |||
| ETF | 230,466 | 265,842 | |||
| Statutory and other payables | 107,258,306 | 83,838,504 | |||
| 112,203,206 | 88,889,804 | ||||
| As at 31.03.2021 Rs. | As at 31.03.2020 Rs. | As at 01.04.2019 Rs. |
|||
| Prime Lands (Pvt) Ltd | 5,966,006 | 4,681,229 | |||
| 5,966,006 | 4,681,229 | ||||
| As at 31.03.2021 Rs. | As at 31.03.2020 Rs. | As at 01.04.2019 Rs. |
|||
| Mr. Premalal Brahmanage | - | 245,500,000 | - | ||
| Mrs. H.K.S.R Perera | - | 145,500,000 | - | ||
| - | 391,000,000 | - | |||
| Note | As at 31.03.2021 Rs. | As at 31.03.2020 Rs. | As at 01.04.2019 Rs. |
||
| Project advance | 29.1 | 2,330,439,139 | 3,733,443,973 | 4,707,121,826 | |
| Customer payables | 33,196,208 | 33,196,208 | 33,206,208 | ||
| Direct customer deposits | 174,133,215 | 148,730,917 | 118,843,204 | ||
| 2,537,768,562 | 3,915,371,098 | 4,859,171,238 | |||
| Balance at the beginning of the year | 3,733,443,973 | 4,707,121,826 | 3,324,908,565 | ||
| Add: During the year advance received amount | 6,339,205,936 | 4,751,483,242 | 4,988,865,095 | ||
| 10,072,649,909 | 9,458,605,068 | 8,313,773,660 | |||
| Less : Transferred to statement of comprehensive income | (7,742,210,770) | (5,725,161,095) | (3,606,651,834) | ||
| 2,330,439,139 | 3,733,443,973 | 4,707,121,826 | |||
| In the normal course of business, the Company makes various commitments and incurs contingent liabilities. No material losses are anticipated as a result of these transactions. |
|||||
| The Company has entered into agreements with contractors to pay Rs. 7,024,809,232 in order to complete the projects included in inventory properties as at the reporting date. The commitment of the Company depends on the successful completion of the project as agreed in the contractors’ agreement. | |||||
| The Company does not have significant contingencies as at the reporting date. | |||||
| The following assets have been pledged as security for credit facilities and loans obtained by the Company from respective financial institutions concerned. | |||||
| Nature of assets | Nature of liabilities | Facility amount Rs | As at 31.03.2021 Rs. | As at 31.03.2020 Rs. |
|
| Lien over Fixed deposit amounting Rs. 568 Mn of Prime Lands (Pvt) Ltd | DFCC Bank - Revolving loan | 200,000,000 | 200,000,000 | - | |
| Primary mortgage for Rs. 200 Mn over Investment property at No.61, D.S Senanayake Mawatha, Colombo 08. | DFCC Bank - Term loan | 200,000,000 | 107,370,065 | 127,083,322 | |
| Lien over Fixed deposit amounting Rs. 568 Mn of Prime Lands (Pvt) Ltd | DFCC Bank - Overdra | 280,000,000 | 114,913,607 | 277,113,744 | |
| A primary mortgage for Rs.225 Mn over the Inventory property at No. 43, Kassapa Road , Colombo 05. (Kassapa 02 project) | Seylan Bank - Overdra | 225,000,000 | 102,939,327 | 220,861,282 | |
| Corporate Guarantee for Rs. 2,000 Mn from Prime Lands (Pvt) Ltd | Seylan Bank - Term loan | 850,000,000 | 2,037,499,000 | 662,499,400 | |
| Lien over 400,000,000 Nos of HNB Finance PLC shares owned by Prime Lands (Pvt) Ltd. | Seylan Bank - Term loan | 1,500,000,000 | |||
| Lien over Fixed deposit amounting Rs. 300 Mn of Prime Lands (Pvt) Ltd. | Seylan Bank - Overdraft | 1,000,000,000 | 538,534,982 | 999,539,370 | |
| Lien over 74,926,029 Nos of Prime Finance PLC shares owned by Prime Lands (Pvt) Ltd. | Seylan Bank PLC - Revolving import loan | 900,000,000 | 707,619,751 | 500,803,000 | |
| A primary mortgage for Rs. 2,200 Mn over the inventory property at No. 62 & 64, Ward Place, Colombo 07. | Sampath Bank -Term loan | 2,200,000,000 | 1,312,462,400 | 1,749,950,000 | |
| Lien over USD A/C amounting to USD 750,000 of Prime Lands Residencies PLC | Sampath Bank - Overdra | 222,000,000 | 124,703,313 | 142,450,497 | |
| Lien over Fixed Deposit amounting Rs. 26.4 Mn of Prime Lands Residencies PLC |
|||||
| Corporate guarantee of Rs.100 Mn from Prime Lands (Pvt) Ltd | |||||
| Corporate guarantee of Rs.164 Mn from Prime Lands (Pvt) Ltd | Hatton National Bank- Overdraft | 164,000,000 | 264,421,302 | 577,867,220 | |
| Corporate guarantee of Rs.125 Mn from Prime Lands (Pvt) Ltd | 125,000,000 | ||||
| Corporate guarantee from Prime Lands (Pvt) Ltd for Rs. 50 Mn. | Union Bank- Overdraft | 50,000,000 | 225,537 | 25,457,753 | |
| Primary mortgage bond for Rs.175 Mn over the Investment property at No 123, Castle Street, Colombo 08. | Na ons Trust Bank Overdraft | 175,000,000 | 3,527,840 | 172,476,042 | |
| Personal Guarantee from Director of Mr. H.M.N.U Kumara of Prime Lands Residencies PLC | Prime Finance PLC - Term loan | 25,000,000 | 17,822,450 | 21,765,994 | |
| Prime Finance PLC - Term loan | 25,000,000 | 17,822,450 | 21,765,994 | ||
| The immediate and ultimate parent of the Company as at 31st March 2021 is Prime Lands (Pvt) Ltd. |
|||||
| Key management personnel include all the members of the Board of Directors of the Company having authority and responsibilities for planning , directing and controlling the activities of the Company. | |||||
| (a) Loans to Directors | |||||
| No Loans were advanced to the Directors of the Company. | |||||
| (b) Key Management Personnel Compensation | |||||
| The remuneration of directors and other members of the key management during the year under review is as follows: | |||||
| Key management personnel | Nature of the transaction | For the year ended 31.03.2021 Rs. | For the year ended 31.03.2020 Rs. |
||
| Directors | Short-term benefit | 72,000,000 | 24,000,000 | ||
| (c) Transactions with key Management Personal | |||||
| - Mr. Premalal Brahmanage | (581,913,119) | - | |||
| - Mrs. H.K.S.R Perera | (373,500,000) | - | |||
| Director's current account receipts | |||||
| - Mr. Premalal Brahmanage | 336,413,119 | 245,500,000 | |||
| - Mrs. H.K.S.R Perera | 228,000,000 | 145,500,000 | |||
| Related companies | Relationship | Nature of the transaction | For the year ended 31.03.2021 Rs. | For the year ended 31.03.2020 Rs. |
|
| Prime Lands (Pvt) Ltd | Parent Company | Customer deposits collected by Prime Lands (Pvt) Ltd on behalf of Prime Lands Residencies PLC | 86,264,500 | 64,861,840 | |
| Payments made by Prime Lands Residencies PLC on behalf of Prime Lands (Pvt) Ltd | - | 402,268,570 | |||
| Land transferred to Prime Lands (Pvt) Ltd | - | 48,000,000 | |||
| Net amount of Fund transferred to Prime Lands (Pvt) Ltd | 14,000,150 | 29,451,513 | |||
| Payments made by Prime Lands (Pvt) Ltd on behalf of Prime Lands Residencies PLC | 68,765,625 | 506,970,132 | |||
| Customer deposits accepted by Prime Lands Residencies PLC on behalf of Prime Lands (Pvt) Ltd | 30,529,000 | 38,896,569 | |||
| Shared service fee from Prime Lands Residencies PLC to Prime Lands (Pvt) Ltd | 30,000,000 | - | |||
| Rent expenses from Prime Lands Residencies PLC to Prime Lands (Pvt) Ltd | 6,000,000 | - | |||
| Prime Finance PLC | Related Company | Rent income to Prime Lands Residencies PLC from Prime Finance PLC | 12,000,000 | - | |
| The following related party balances are shown in the respective notes as stated below. 1. Investment in non-convertible redeemable debentures issued by Prime Lands Australia (Pty) Limited as given in Note 14. 2. Amount due to Prime Lands (Pvt) Ltd as disclosed in Note 27. |
|||||
| Transactions with related parties are carried out in the ordinary course of the business. Outstanding current account balances at the year end as disclosed in Note 27 are interest free and settled on demand. Investment in unquoted debentures at the year end as disclosed in Note 14 is at an interest rate of 6% per annum and settlement occurs at maturity of five years. | |||||
| The fair values of financial assets and liabilities, together with carrying amounts shown in the Statement of Financial Position, are as follows; | |||||
Balance as at 31.03.2021 | Financial assets at fair value through profit or loss Rs. | Financial assets at amortized cost Rs. | Other financial liabilities at amortized cost Rs. | Total Rs. |
|
| Financial investments - unquoted debentures | |||||
| Financial investments - quoted equity share | - | ||||
| Cash and cash equivalents | |||||
| Interest bearing borrowings | |||||
| Lease liabilities | |||||
| Amount due to related party | |||||
| Trade and other payables | |||||
| Bank overdraft | |||||
Balance as at 31.03.2020 | Financial assets at fair value through profit or loss Rs. | Financial assets at amortized cost Rs. | Other financial liabilities at amortized cost Rs. | Total Rs. |
|
| Financial investments - unquoted debentures | - | 270,194,898 | - | 270,194,898 | |
| Financial investments - quoted equity share | 180,000 | - | - | 180,000 | |
| Cash and cash equivalents | - | 172,541,712 | - | 172,541,712 | |
| 180,000 | 442,736,610 | - | 442,916,610 | ||
| Interest bearing borrowings | - | - | 3,183,043,737 | 3,183,043,737 | |
| Lease liabilities | - | - | 57,654,060 | 57,654,060 | |
| Amount due to directors | 391,000,000 | 391,000,000 | |||
| Amount due to related party | - | - | 5,966,006 | 5,966,006 | |
| Trade and other payables | - | - | 497,324,507 | 497,324,507 | |
| Bank overdraft | - | - | 2,936,315,082 | 2,936,315,082 | |
| - | - | 7,071,303,392 | 7,071,303,392 | ||
| As at 31st March 2021, the Company held the following assets carried at fair value on the statement of financial position. The Company uses the following hierarchy for determining and disclosing the fair value of these assets by valuation technique: Level 1:Quoted (unadjusted) prices in active markets for identical assets or liabilities Level 2: Other techniques for which all inputs that have a significant effect on the recorded fair value are observable, either directly or indirectly Level 3: Techniques which use inputs that have a significant effect on the recorded fair value that are not based on observable market data |
|||||
| Level 1 | Level 2 | Level 3 | Total | ||
| Financial assets - Fair value through profit or loss | |||||
| Investment property - Land and building | |||||
| Financial assets - Fair value through pro t or loss | 180,000 | - | - | 180,000 | |
| Investment property - Land and building | - | - | 653,000,000 | 653,000,000 | |
| The following table shows the valuation techniques used in measuring the fair value of investment property, as well as the significant unobservable inputs used. | |||||
| Description | Valuation technique | Significant observable and unobservable inputs | Inter-relationship between key unobservable inputs and fair value measurement | ||
| Bare Land No 123, Castle Street, Colombo 08 | Comparison method valuation | Considering the current land values in the area it has been adjusted for time, nature of land, size and location. The land value is determined by adopting rates Rs. 9,000,000 per perch. | The estimated fair value would increase/ decrease if expected market rentals get high / low. | ||
| Land & Commercial Building No. 61, D S Senanayake Mw, Colombo 08 | Comparison method of valuation and investment method of valuation | Value of land Considering the current land values in the area it has been adjusted for time, nature of land, size and location. The land value is determined by adopting rates Rs. 16,000,000 per perch. | |||
| Value of building Considering the current cost of construction of similar buildings which were obtained from the cost of construction of the subject buildings, compared with information available in respect of other buildings. The building value is determined by adopting rates Rs. 14,000 per sq. Ft. | |||||
No circumstances have arisen since the reporting date, which would require adjustments to, or disclosures in the financial statements except below;
On-going COVID-19 pandemic implications
Subsequent to the reporting date, the Company has monitored the operational performance, internal actions as well as other relevant external factors (such as changes in any of the government restrictions). No adjustments to the key estimates and judgements have been identified that would impact the financial position as at 31 March 2021. Where any material changes in key estimates and judgements have been identified, updates have been made to the financial statements as adjusting post-reporting period events or disclosure to these financial statements.
Listing of Shares on the Colombo Stock Exchange
The Company has issued One Hundred Million (100,000,000) New Ordinary Voting Shares and further issued Eighty-Seven Million and Five Hundred Thousand (87,500,000) New Ordinary Voting Shares as a result of oversubscription of the Initial One Hundred Million (100,000,000) Ordinary Voting Shares, at a price of Rs. 10.40 per share to the general public by way of an Offer for Subscription on the Colombo Stock Exchange and the listing of up to Nine Hundred and Thirty-Seven Million Five Hundred Thousand (937,500,000) Ordinary Voting Shares on the Diri Savi Board of the Colombo Stock Exchange on 11th of May 2021. The listing of shares was effective from the 08th of June 2021 and was classified under the Industry Group “Real Estate (6010)”.
Authorization of interim dividend
The Board of Directors of the Company has authorized an interim dividend of forty cents (-/40cts) per ordinary share amounting to Rs. 375,000,000/- on the 30th June 2021.
The Company has exposure to the following risks from its use of financial instruments :
This note represents qualitative and quantitative information about the Company’s exposure to each of the above risks, the Company’s objectives, policies and procedures for measuring and managing risk and the Company’s management of capital. Further, quantitative disclosures are included throughout these financial statements.
Risk management framework
The Board of Directors has the overall responsibilities for the establishment and oversight of the Company’s risk management framework. The Company’s risk management policies are established to identify and analyze the risk faced by the Company, to set appropriate risk limits and controls, and to monitor risk and adherence to limits. Risk management policies and systems are reviewed regularly to reflect the changes in market conditions and the Company’s activities.
Credit risk is the risk of financial loss to the Company if a customer or a counter party to a financial instrument fails to meet its contractual obligations and arises principally from the Company’s receivables and deposits with banks.
Management of credit risk includes the following components.
The Company does an extensive and continuous evaluation of credit worthiness of its customers / financial institutions by assessing external credit ratings (if available) or historical information about default rates and change the credit limits and payment terms where necessary.
Analysis of credit quality – Maximum exposure to credit risk by class of financial assets
The carrying amount of financial assets represents the maximum credit exposure. The maximum exposure to credit risk at the reporting date was:
| As at 31.03.2021 Rs. | As at 31.03.2020 Rs. |
||
|---|---|---|---|
| Financial assets at amortized cost | 352,939,048 | 270,194,898 | |
| Financial assets - FVTPL | 195,000 | 180,000 | |
| Cash and cash equivalents | 376,799,448 | 172,541,712 |
Liquidity risk is the risk that the Company will encounter difficulty in meeting the obligations associated with its financial liabilities that are settled by delivering cash or another financial assets.
Management of liquidity risk
The Company’s approach to managing liquidity is to ensure, as far as possible, that it will always have sufficient liquidity to meet its liabilities when due, under both normal and stressed condition, without incurring unacceptable losses or risking damages to the Company’s reputation.
The following are the contractual maturities of financial liabilities of the Company;
| Carrying amount Rs | Contractual amount Rs. | Less than 01 year Rs. | More than 01 year Rs. |
||
|---|---|---|---|---|---|
| Trade and other payables | |||||
| Bank overdraft | - | ||||
| Loans and borrowings | |||||
| Lease liabilities | |||||
| Amounts due to related parties | - | ||||
| Trade and other payables | 497,324,507 | 497,324,507 | 497,324,507 | - | |
| Bank overdraft | 2,936,315,082 | 2,936,315,082 | 2,936,315,082 | - | |
| Loans and borrowings | 3,183,043,737 | 3,183,043,737 | 1,593,957,546 | 1,589,086,191 | |
| Lease liabilities | 57,654,060 | 86,676,162 | 14,107,089 | 48,270,500 | |
| Amounts due to related parties | 5,966,006 | 5,966,006 | 5,966,006 | - | |
| 6,680,303,392 | 6,709,325,494 | 5,047,670,230 | 1,637,356,691 |
Foreign currency risk is the risk that the fair value or future cash flow of a financial instrument will fluctuate because of changes in foreign exchange rates.
The Company is exposed to currency risk on investments in unquoted debentures which are denominated in Australian Dollars (AUD).
The Sri Lankan Rupee witnessed a depreciation against major currencies in the backdrop of economic turmoil in global, regional and local markets resulting from the COVID-19 pandemic. The Company managed this risk with prudent foreign currency risk management practices in dealing with transactions denominated in foreign currencies.Interest rate risk is the risk that the fair value or future cash flows of a financial instrument will fluctuate because of changes in market interest rates. The exposure to the risk of changes in market interest rate relates primarily to the Company’s long-term debt obligations and investments with floating interest rates.
The evolving COVID-19 pandemic has resulted in consecutive reductions in policy rates and monetary easing policies by the Central Bank of Sri Lanka to encourage banks and finance companies to reduce lending rates.
At the end of the reporting period, the interest rate profile of the Company’s interest-bearing financial instruments as reported to the management of the Company was as follows;| As at 31.03.2021 Rs. | As at 31.03.2020 Rs. |
|
|---|---|---|
| Fixed deposit | 182,540,341 | 27,283,134 |
| Lease creditors | 54,192,252 | 57,654,060 |
| Loans and borrowings | 4,193,779,367 | 3,183,043,737 |
| Bank overdraft | 1,150,057,784 | 2,936,315,082 |
| 5,580,569,744 | 6,204,296,013 |
| Profit or loss | Equity | |||
|---|---|---|---|---|
| For the year ended 31.03.2021 Rs. | For the year ended 31.03.2020 Rs. | For the year ended 31.03.2021 Rs. | For the year ended 31.03.2020 Rs. |
|
| 100 bp increase | 4,106,015 | 6,247,555 | 4,106,015 | 6,247,555 |
| 100 bp decrease | (4,106,015) | (6,247,555) | (4,106,015) | (6,247,555) |
The Board’s policy is to maintain a strong capital base so as to maintain investor, creditor and market confidence and to sustain future development of the business. Capital consists of stated capital and reserves of the Company. The Board of Directors monitors the return on capital, which the Company defines as a result from operating activities divided by total shareholders’ equity. The Board of Directors also monitors the level of dividends to ordinary shareholders.
The Company’s objectives when managing capital are to safeguard the Company’s ability to continue as a going concern in order to provide returns for shareholders and benefits for other stakeholders and to maintain an optimal capital structure to reduce the cost of capital.
The Company’s debt to adjusted capital ratio at the end of the reporting period was as follows:
| As at 31.03.2021 Rs. | As at 31.03.2020 Rs. |
|
|---|---|---|
| 9,566,963,818 | 11,140,042,799 | |
| Less : Cash and cash equivalents | (376,799,448) | (172,541,712) |
| Net debt | 9,190,164,370 | 10,967,501,087 |
| 3,432,952,648 | 2,442,717,586 | |
| Debt to adjusted capital ratio | 2.68 | 4.49 |
| Note | As disclosed in the previous year Rs. | As reclassified in the current year Rs. | Adjustment Rs |
|
|---|---|---|---|---|
| Statement of Comprehensive Income | ||||
| Other income | a | 19,309,102 | 15,222,371 | (4,086,731) |
| Finance income | 23,215,477 | 27,302,208 | 4,086,731 | |
| Administration expenses | b | 282,624,655 | 268,582,576 | (14,042,079) |
| Finance expenses | 625,725,497 | 639,767,576 | 14,042,079 | |
| Statement of Financial Position | ||||
| Financial investment - Short-term | c | 27,283,134 | - | (27,283,134) |
| Cash and cash equivalents | 145,258,578 | 172,541,712 | 27,283,134 |
The Company did not provide for Deferred taxation in prior years due to differences in the application of tax provisions. This was corrected during the period. Accordingly, the Company retrospectively adjusted the deferred tax liability in the Financial statements.
The following is a summary of the impact on the Financial Statements due to the above;
Impact to statement of financial position| As previously reported Rs. | Adjustments Rs. | Restated Rs. |
|
|---|---|---|---|
| Deferred tax liabilities | - | 14,543,272 | 14,543,272 |
| Retained earnings | 1,227,055,639 | (14,543,272) | 1,212,512,367 |
| Deferred tax liabilities | - | 21,239,423 | 21,239,423 |
| Retained earnings | 958,360,465 | (21,239,423) | 937,121,042 |
| Income tax expenses | 44,291,465 | 6,696,151 | 50,987,616 |
| Profit for the year | 137,625,857 | (6,696,151) | 130,929,706 |
| GRI Standard/Disclosure | Page No. | Page Title / Report Commentary |
|---|---|---|
| Organisational profile | ||
| 102- 1. Name of the organisation | 137 | Corporate Information |
| 102 -2. Activities, brands, products and services | 95 | Note 1.2 |
| 102 -3 Location of headquarters | 137 | Corporate Information |
| 102-4. Location of Operations | 8 to 9 | Our Properties at a Glance |
| 102-5. Ownership and legal form | 6 137 | About the Company Corporate Information |
| 102-6. Markets served | 6 | About the Company |
| 102-7. Scale of the organisation | 20 | Highlights |
| 102-8. Information on employees and other workers | 59 | Human Capital - Cadre Numbers |
| 102-9. Supply chain | 69 | Social and Relationship Capital - Supply Chain Management |
| 102-10 Significant changes to the organisation and its supply chain | 69 | Social and Relationship Capital - Supply Chain Management |
| 102-11. Precautionary principle or approach | 22 | Key Risks - Risk Appetite |
| 102-12. External initiatives | 4 19 | Report Pro le - Repor ng Frameworks Value Creation Model - Contribution to the SDG’s |
| 102-13 Membership of associations | 56 | Intellectual Capital - Memberships and Affiliation |
| Strategy | ||
| 102-14. Statement from senior decision-maker | 33 to 36 | Joint Statement by Co-Chairman and Co-Chairperson |
| Ethics and Integrity | ||
| 102 -15. Values, principles, standards, and norms of behaviour | 56 | Intellectual Capital - Ethics and Integrity |
| Governance | ||
| 102-18. Governance structure | 75 | Corporate Governance Report - Governance Structure |
| 102-19. Delegating authority | 76 | Corporate Governance Report - Delegation of Authority by the Board |
| 102-22. Composition of the highest governance body and its committees | 75 | Corporate Governance Report - The Board |
| 102-23. Chair of the highest governance body | 79 | Corporate Governance Report - Chairman’s Role (Principle A.3, A.3.1) |
| 102-24. Nominating and selecting the highest governance body | 77 | Corporate Governance Report -Remuneration, Nomination and Human Resources Committee (Duties and Responsibilities) |
| 102-25. Conflicts of interest | 77 | Corporate Governance Report - Related Party Transaction Review Committee (Duties and Responsibilities) |
| GRI Standard/Disclosure | Page No. | Page Title / Report Commentary |
|---|---|---|
| 102-35. Remuneration policies. | 60 | Human Capital- Remuneration and Benefits |
| 102-36. Process for determining remuneration | 77 | Corporate Governance Report - Remuneration, Nomination and Human Resources Committee (Duties and Responsibilities) |
| Stakeholder Engagement | ||
| 102-40. List of stakeholder groups | 25 | Stakeholder Interactions |
| 102-41. Collective bargaining agreements | 62 | Human Capital - Employee Relations |
| 102-42. Identifying and selecting stakeholders | 25 | Stakeholder Interactions |
| 102-43. Approach to stakeholder engagement | 25 | Stakeholder Interactions |
| 102-44. Key topics and concerns raised | 25 to 26 | Stakeholder Engagement Mechanism |
| Reporting Practice | ||
| 102-45. Entities included in the consolidated financial statements | 4 | Report Profile- Scope and Boundary |
| 102-46. Defining report content and topic boundaries | 4 27 to 29 | Report Profile- Materiality Material Topics |
| 102-47. List of material topics | 27 to 29 | Material Topics |
| 102-48. Restatement of information | 4 | Report Profile - Introduction |
| 102-49. Changes in reporting | 4 | Report Profile - Introduction |
| 102-50. Reporting period | 4 | Report Profile -Scope and Boundary |
| 102-51. Date of most recent report | 4 | Report Profile -Introduction |
| 102-52. Reporting cycle | 4 | Report Profile -Scope and Boundary |
| 102-53. Contact point for questions regarding the report | 5 | Report Profile - Feedback |
| 102-54. Claims of reporting in accordance with the GRI Standards | This report has been prepared in accordance with the GRI Standards: Core option | |
| 102-55. GRI content index | 133 to 136 | |
| 102-54. External assurance | The Company aims to progress towards securing external assurance in the next reporting cycle | |
| 103 - 1. Explanation of the material topic and its boundary | 27 to 29 | Material Topics |
| 103 - 2. The management approach and its components | 27 to 29 | Material Topics |
| 103 - 3. Evaluation of the management approach | 27 to 29 | Material Topics |
| GRI 201: Economic performance 2016 | ||
| GRI 201 - 1. Direct economic value generated and distributed | 46 | Financial Capital - Value Creation for Stakeholders |
| GRI 202 : Market Presence 2016 | ||
| 202 - 1. Ratios of standard entry level wage by gender compared to local minimum wage | 60 | Human Capital - Remuneration and Benefits |
| GRI Standard/Disclosure | Page No. | Page Title / Report Commentary |
|---|---|---|
| GRI 203: Indirect economic impact 2016 | ||
| 203-2. Significant indirect economic impacts | 69 | Social and Relationship Capital - Contribution towards the development of local economies |
| GRI 204: Procurement Practices 2016 | ||
| 204 -1. Proportion of spending on local suppliers | 19 69 | Value Creation model Social and Relationship Capital - Supply Chain Management |
| GRI 205: Anti -corruption Practices 2016 | ||
| 205-1. Operations assessed for risks related to corruption | 56 | Intellectual Capital - Ethics and Integrity |
| GRI 206: Anti -competitive Behaviour 2016 | ||
| 206-1 Legal actions for anti -competitive behavior, anti trust, and monopoly practices | 56 | Intellectual Capital - Ethics and Integrity |
| GRI 207: Tax 2019 | ||
| 207-1. Approach to tax | 48 | Financial Capital Tax Framework |
| GRI 303: Water and Effluents 2018 | ||
| 303-1. Interactions with water as a shared resource | 71 | Natural Capital - Construction Best Practices |
| GRI 306: Waste 2020 | ||
| 306-2. Management of significant waste-related impacts | 71 | Natural Capital - Sustainable Resource Utilisation |
| GRI 307: Environmental Compliance 2016 | ||
| 307-1 Non-compliance with environmental laws and regulations | 54 71 | Intellectual Capital - Regulatory Compliance Natural Capital - Construction Best Practices |
| GRI 401: Employment 2016 | ||
| 401-1. New employee hires and employee turnover 401-2. Benefits provided to full- time employees that are not provided to temporary or part- time employees 401-3. Parental leave | 60 60 61 | Human Capital - New Hires & Employee Turnover Human Capital - Remuneration and Benefits Human Capital - Maternity Leave |
| GRI 402: Labour Management and Relations 2016 | ||
| 402-1. Minimum notice periods regarding operational changes | 62 | Human Capital - Employee Relations |
| GRI 403 : Occupational Health and Safety 2018 | ||
| 403-1. Occupational health and safety management system | 62 | Human Capital - Employee Wellbeing |
| GRI 404: Training and Education 2016 | ||
| 404-1. Average hours of training per year per employee | 61 | Human Capital - Training and Development |
| 404-3. Percentage of employees receiving regular performance and career development reviews | 61 | Human Capital - Performance Management |
| GRI Standard/Disclosure | Page No. | Page Title / Report Commentary |
|---|---|---|
| GRI 405: Diversity and Equal Opportunity 2016 | ||
| 405-1. Diversity of governance bodies and employees | 75 59 | Corporate Governance Report- The Board Human Capital - Cadre Numbers |
| 405-2. Ratio of basic salary and remuneration of women to men | 60 | Human Capital - Remuneration and Benefits |
| GRI 406: Non Discrimina on 2016 | ||
| 406-1. Incidents of discrimination and corrective actions taken | 61 | Human Capital - Performance Management |
| GRI 407: Freedom of Association and Collective Bargaining 2016 | ||
| 407 -1. Operations and suppliers in which the right to freedom of association and collective bargaining may be at risk | 62 | Human Capital - Employee Relations |
| GRI 408: Child Labour 2016 | ||
| 408-1. Operations and suppliers at significant risk for incidents of child labour | 60 | Human Capital - Recruitment and Selection |
| GRI 409: Forced or Compulsory Labour 2016 | ||
| 409-1. Opera ons and suppliers at significant risk for incidents of forced or compulsory labor | 62 | Human Capital - Employee Relations |
| GRI 410: Security Practices 2016 | ||
| 410-1. Security personnel trained in human rights policies or procedures | 56 | Intellectual Capital - Ethics and Integrity |
| GRI 412: Human Rights Assessment 2016 | ||
| 412-1. Opera ons that have been subject to human rights reviews or impact assessments | 56 | Intellectual Capital - Ethics and Integrity |
| GRI 413: Local Communities 2016 | ||
| 413-1. Opera ons with significant actual and potential negative impacts on local communities | 69 | Social and Relationship Capital - Contribution towards the development of local economies |
| GRI 415: Public Policy 2016 | ||
| 415-1. Political contributions | 56 | Intellectual Capital - Ethics and Integrity |
| GRI 416 : Customer Health and Safety 2016 | ||
| 416-2. Incidents of non-compliance concerning the health and safety impacts of products and services | 54 64 | Intellectual Capital - Regulatory Compliance Social and Relationship Capital - Product Responsibility |
| GRI 417: Marke ng and Labelling 2016 | ||
| 417-3 Incidents of non-compliance concerning marketing communications | 68 | Social and Relationship Capital - Transparency of Marketing Information |
| GRI 418: Customer Privacy 2016 | ||
| 418-1. Substantiated complaints concerning breaches of customer privacy and losses of customer data | 68 | Social and Relationship Capital - Confidentiality and Customer Privacy |
| GRI 419: Socioeconomic Compliance 2016 | ||
| 419-1. Non-compliance with laws and regulations in the social and economic area | 54 | Intellectual Capital - Regulatory Compliance |
Mr. P Brahmanage
Co-Chairman / Executive Director
Mrs. H K S R Perera
Co-Chairperson / Executive Director
Mr. N M Weerakkody
Managing Director / Executive Director
Mr. H M N U Kumara
Executive Director/ Director – Corporate Affairs
Mrs. S S A P Brahmanage
Executive Director
Mr. D Sooriyaarachchi
Independent Non-Executive Director
Mr. S Bandara
Independent Non-Executive Director
Mr. D Kalapuge
Non-Executive Director
Mr. M Perera
Non-Executive Director
By order of the Board of Directors of
By Order of the Board
Prime Lands Residencies PLC
(Signed)
Pele Consulting (Pvt) Ltd.
Company Secretary
Date: 7th September 2021
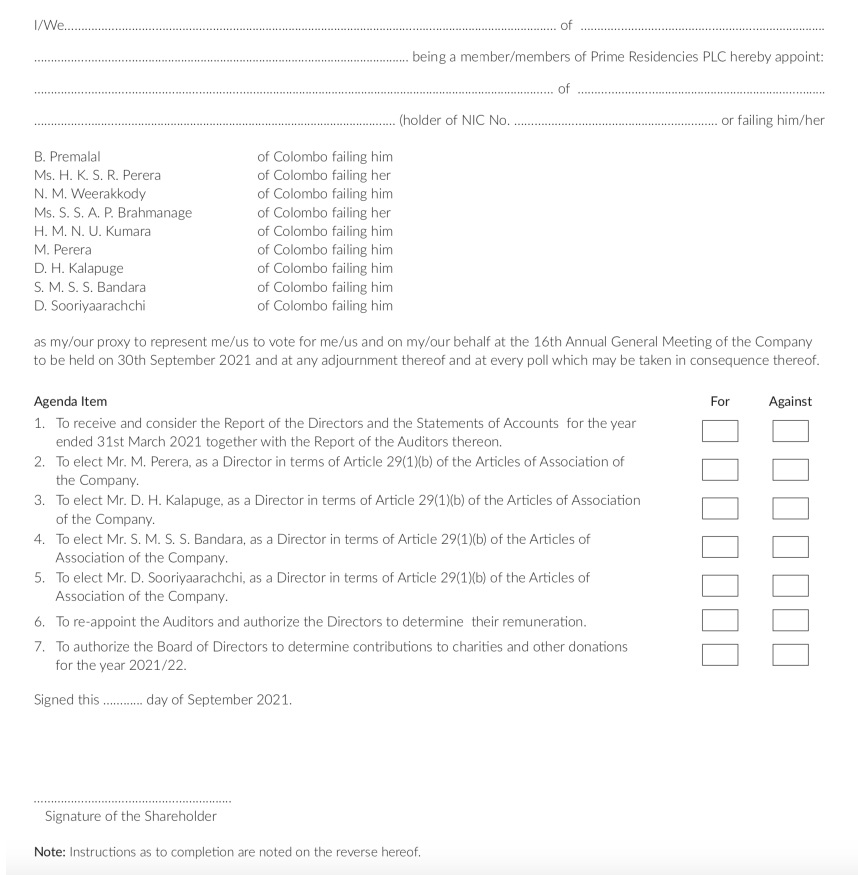
INSTRUCTIONS ON HOW TO COMPLETE THE FORM OF PROXY


